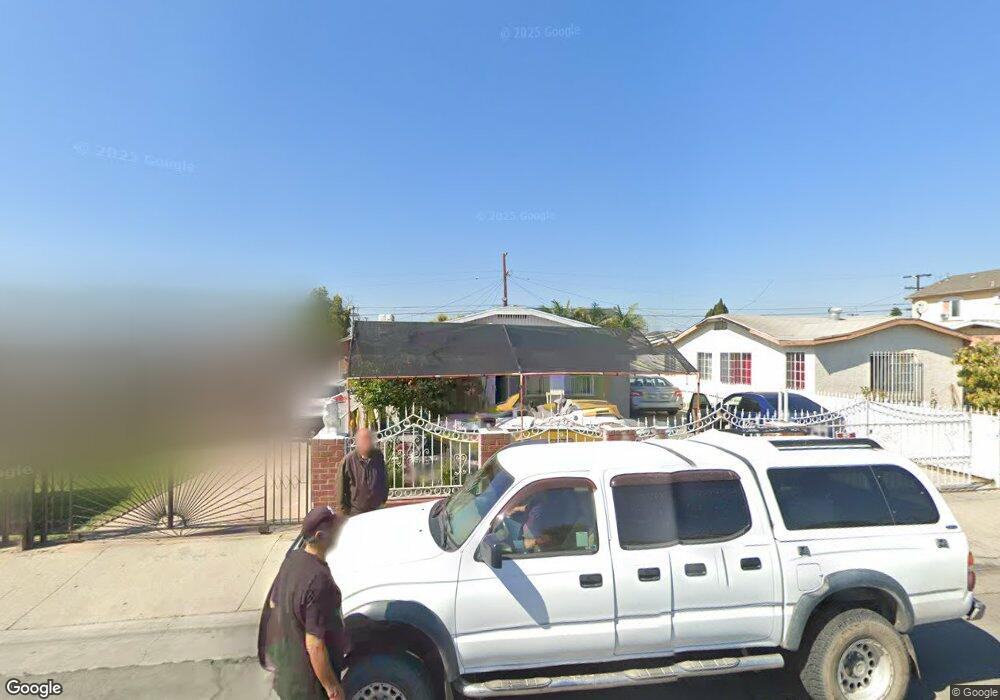
8131 Walnut Dr Los Angeles, CA 90001
Estimated Value: $576,000 - $695,000
3
Beds
2
Baths
1,198
Sq Ft
$522/Sq Ft
Est. Value
About This Home
This home is located at 8131 Walnut Dr, Los Angeles, CA 90001 and is currently estimated at $625,744, approximately $522 per square foot. 8131 Walnut Dr is a home located in Los Angeles County with nearby schools including Graham Elementary School, Charles Drew Middle School, and Academy For Multiligual Arts And Science At Mervyn M. Dymally High.
Ownership History
Date
Name
Owned For
Owner Type
Purchase Details
Closed on
May 1, 2002
Sold by
Almaraz Jose L and Almaraz Maria L
Bought by
Almaraz Jose L and Almaraz Maria L
Current Estimated Value
Home Financials for this Owner
Home Financials are based on the most recent Mortgage that was taken out on this home.
Original Mortgage
$171,891
Outstanding Balance
$71,612
Interest Rate
6.74%
Mortgage Type
FHA
Estimated Equity
$554,132
Purchase Details
Closed on
May 28, 1996
Sold by
Hall Ervin E and Svenson Rick L
Bought by
Almaraz Jose L and Almaraz Maria L
Home Financials for this Owner
Home Financials are based on the most recent Mortgage that was taken out on this home.
Original Mortgage
$155,675
Interest Rate
8.3%
Mortgage Type
FHA
Purchase Details
Closed on
Apr 8, 1996
Sold by
Moreno Maria and Aguilera George
Bought by
Hall Ervin E and Svenson Rick L
Home Financials for this Owner
Home Financials are based on the most recent Mortgage that was taken out on this home.
Original Mortgage
$155,675
Interest Rate
8.3%
Mortgage Type
FHA
Create a Home Valuation Report for This Property
The Home Valuation Report is an in-depth analysis detailing your home's value as well as a comparison with similar homes in the area
Home Values in the Area
Average Home Value in this Area
Purchase History
| Date | Buyer | Sale Price | Title Company |
|---|---|---|---|
| Almaraz Jose L | -- | Stewart Title | |
| Almaraz Jose L | $162,500 | Benefit Land Title Company | |
| Hall Ervin E | $76,500 | -- |
Source: Public Records
Mortgage History
| Date | Status | Borrower | Loan Amount |
|---|---|---|---|
| Open | Almaraz Jose L | $171,891 | |
| Previous Owner | Almaraz Jose L | $155,675 |
Source: Public Records
Tax History
| Year | Tax Paid | Tax Assessment Tax Assessment Total Assessment is a certain percentage of the fair market value that is determined by local assessors to be the total taxable value of land and additions on the property. | Land | Improvement |
|---|---|---|---|---|
| 2025 | $3,906 | $264,474 | $143,316 | $121,158 |
| 2024 | $3,906 | $259,289 | $140,506 | $118,783 |
| 2023 | $3,845 | $254,205 | $137,751 | $116,454 |
| 2022 | $3,679 | $249,221 | $135,050 | $114,171 |
| 2021 | $3,636 | $244,335 | $132,402 | $111,933 |
| 2019 | $3,531 | $237,090 | $128,476 | $108,614 |
| 2018 | $3,381 | $232,442 | $125,957 | $106,485 |
| 2016 | $3,233 | $223,418 | $121,067 | $102,351 |
| 2015 | $3,184 | $220,063 | $119,249 | $100,814 |
| 2014 | $3,186 | $215,754 | $116,914 | $98,840 |
Source: Public Records
Map
Nearby Homes
- 8301 Elm St
- 8219 Crockett Blvd
- 8024 Crockett Blvd
- 8241 Alix Ave
- 8036 Alix Ave
- 1959 Firestone Blvd
- 8511 Maie Ave
- 7672 Whitsett Ave
- 8230 Compton Ave
- 8637 Holmes Ave
- 1622 Firestone Blvd
- 8632 S Fir Ave
- 7659 Miramonte Blvd
- 8109 Antwerp St
- 7533 Maie Ave
- 1420 E 77th Place
- 8820 Beach St Unit 2
- 1972 E 88th St
- 8904 Bandera St
- 8467 Zamora Ave
- 8127 Walnut Dr
- 8135 Walnut Dr
- 8123 Walnut Dr
- 8139 Walnut Dr
- 8122 Walnut Dr
- 8119 Walnut Dr
- 8143 Walnut Dr
- 8132 Holmes Ave
- 8136 Holmes Ave
- 8128 Holmes Ave
- 8140 Holmes Ave
- 8122 Holmes Ave
- 8115 Walnut Dr
- 8144 Holmes Ave
- 8120 Holmes Ave
- 8132 Walnut Dr
- 8128 Walnut Dr
- 8136 Walnut Dr
- 8111 Walnut Dr
- 8124 Walnut Dr
Your Personal Tour Guide
Ask me questions while you tour the home.