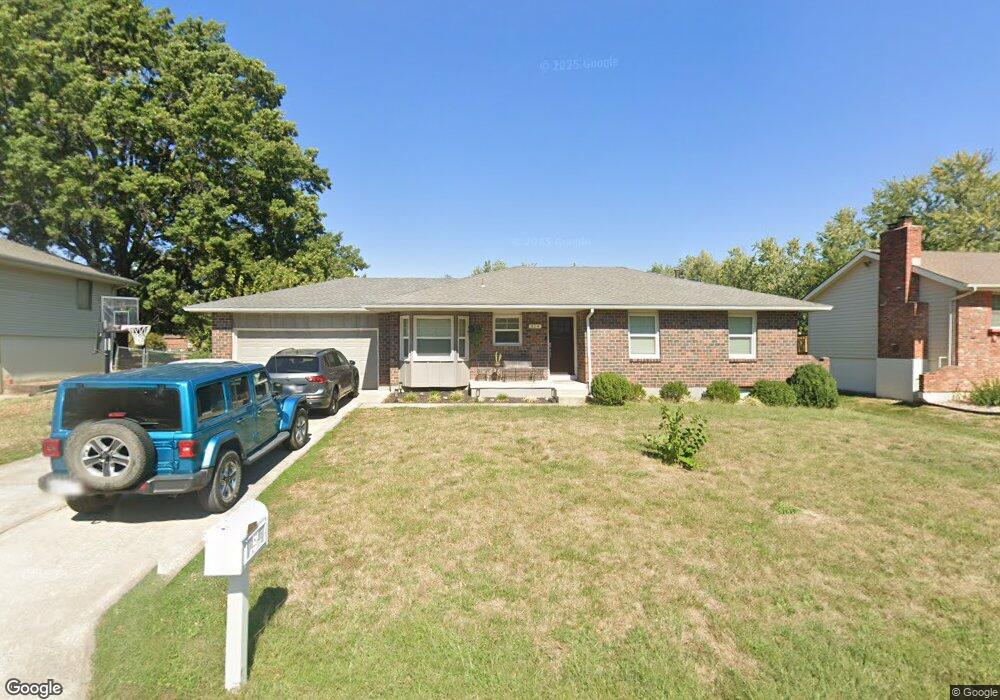
814 NE Cedar St Lees Summit, MO 64086
Estimated Value: $298,192 - $324,000
4
Beds
4
Baths
1,306
Sq Ft
$236/Sq Ft
Est. Value
About This Home
This home is located at 814 NE Cedar St, Lees Summit, MO 64086 and is currently estimated at $308,548, approximately $236 per square foot. 814 NE Cedar St is a home located in Jackson County with nearby schools including Meadow Lane Elementary School, Bernard C. Campbell Middle School, and Lee's Summit North High School.
Ownership History
Date
Name
Owned For
Owner Type
Purchase Details
Closed on
Jul 18, 2023
Sold by
Davis Tia
Bought by
Tia J Davis Trust and Davis
Current Estimated Value
Purchase Details
Closed on
Jun 5, 2017
Sold by
Bermel Josephine
Bought by
Davis Tia
Purchase Details
Closed on
Oct 28, 2014
Sold by
Gary Brown Homes Llc
Bought by
Bermel Josephine A
Purchase Details
Closed on
Jan 28, 2014
Sold by
Millar Justin G
Bought by
Gary Brown Homes Llc
Purchase Details
Closed on
Oct 9, 2009
Sold by
Millar Lowell T
Bought by
Millar Justin G
Purchase Details
Closed on
Aug 29, 2007
Sold by
Millar K B and Millar Kenneth Byron
Bought by
Millar K B and K B Millar Trust
Purchase Details
Closed on
Apr 17, 2006
Sold by
Lally Millar Luvena K
Bought by
Millar Kenneth M
Purchase Details
Closed on
Aug 6, 1998
Sold by
Lally Luvena K and Lally Luvena K
Bought by
Lally Millar Luvena K and Luvena K Lally Millar Trust
Create a Home Valuation Report for This Property
The Home Valuation Report is an in-depth analysis detailing your home's value as well as a comparison with similar homes in the area
Home Values in the Area
Average Home Value in this Area
Purchase History
| Date | Buyer | Sale Price | Title Company |
|---|---|---|---|
| Tia J Davis Trust | -- | None Listed On Document | |
| Davis Tia | -- | None Available | |
| Bermel Josephine A | -- | Coffelt Land Title Inc | |
| Gary Brown Homes Llc | -- | Coffelt Land Title Inc | |
| Millar Justin G | -- | None Available | |
| Millar K B | -- | None Available | |
| Millar Kenneth M | -- | Coffelt Land Title Inc | |
| Lally Millar Luvena K | -- | -- |
Source: Public Records
Tax History
| Year | Tax Paid | Tax Assessment Tax Assessment Total Assessment is a certain percentage of the fair market value that is determined by local assessors to be the total taxable value of land and additions on the property. | Land | Improvement |
|---|---|---|---|---|
| 2025 | $2,701 | $38,445 | $6,629 | $31,816 |
| 2024 | $2,682 | $37,409 | $7,355 | $30,054 |
| 2023 | $2,682 | $37,409 | $4,571 | $32,838 |
| 2022 | $2,347 | $29,070 | $4,331 | $24,739 |
| 2021 | $2,395 | $29,070 | $4,331 | $24,739 |
| 2020 | $2,310 | $27,766 | $4,331 | $23,435 |
| 2019 | $2,247 | $27,766 | $4,331 | $23,435 |
| 2018 | $2,108 | $24,166 | $3,770 | $20,396 |
| 2016 | $2,076 | $23,560 | $3,553 | $20,007 |
Source: Public Records
Map
Nearby Homes
- 809 NE Cedar St
- 812 NE Mulberry St
- 1708 NE Balboa St
- 816 NE Pollard St
- 928 NE Mulberry St
- 1138 NE Mulberry St
- 1133 NE Mulberry St
- 400 NE Mulberry St
- 1300 NE Browning Ln
- .342 acres NE Victoria Dr
- 1404 NE Grand Ave
- 1118 NE Deerbrook Terrace
- 1213 NE Ball Dr
- 1701 NE Auburn Dr
- 1217 NE Magnolia St
- 1108 NE Woodbury Ct
- 12505 S Woodlawn Dr
- 905 NE Country Ln
- 1345 NE Foxwood Dr
- 1700 NE Bluff St
- 816 NE Cedar St
- 812 NE Cedar St
- 817 NE Cedar St
- 815 NE Cedar St
- 819 NE Cedar St
- 811 NE Cedar St
- 821 NE Cedar St
- 27301 NE Cedar St
- 27315 NE Cedar St
- 27307 NE Cedar St
- 808 NE Cedar St
- 1700 NE White Dr
- 1611 NE White Dr Unit A
- 1702 NE White Dr
- 806 NE Cedar St
- 814 NE Chestnut St
- 812 NE Chestnut St
- 816 NE Chestnut St
- 807 NE Cedar St
- 1701 NE White Dr Unit A
Your Personal Tour Guide
Ask me questions while you tour the home.