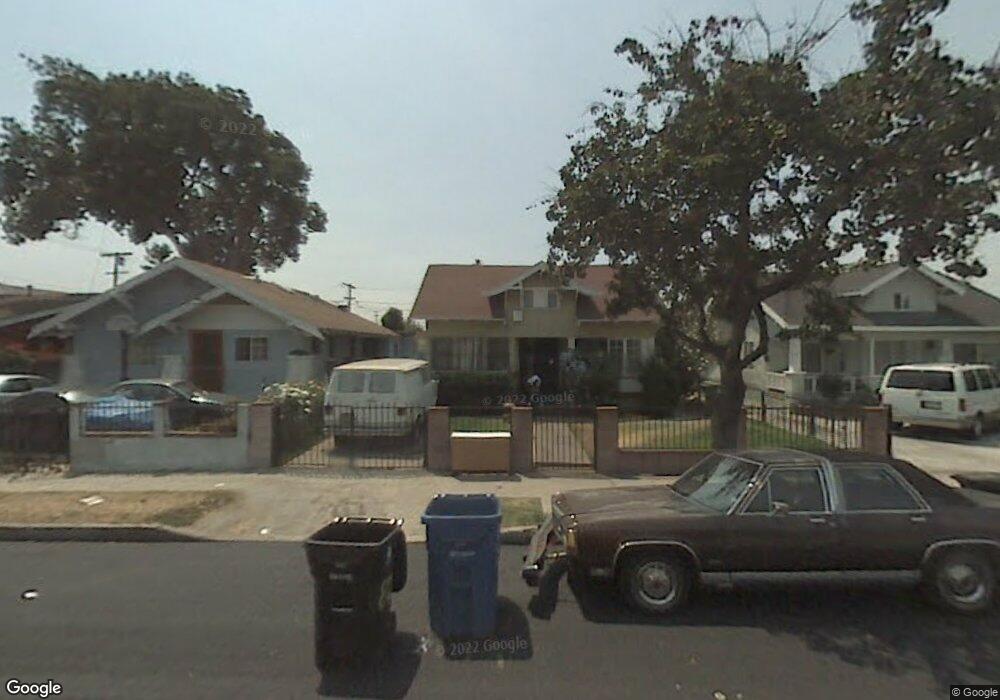
814 W 56th St Los Angeles, CA 90037
Vermont-Slauson NeighborhoodEstimated Value: $717,000 - $989,000
4
Beds
3
Baths
1,970
Sq Ft
$443/Sq Ft
Est. Value
About This Home
This home is located at 814 W 56th St, Los Angeles, CA 90037 and is currently estimated at $873,544, approximately $443 per square foot. 814 W 56th St is a home located in Los Angeles County with nearby schools including Fifty-Second Street Elementary School, John Muir Middle School, and Augustus F. Hawkins High A Critical Design And Gaming.
Ownership History
Date
Name
Owned For
Owner Type
Purchase Details
Closed on
Sep 12, 2025
Sold by
Martinez Araceli Cruz and Guillen Angel
Bought by
Guillen Family Trust and Guillen
Current Estimated Value
Purchase Details
Closed on
Aug 8, 2025
Sold by
Cruz Deguillen Araceli and Angel Guillen Angel
Bought by
Deguillen Araceli Cruz and Guillen Angel
Purchase Details
Closed on
Jul 18, 2014
Sold by
Betancourth Leonardo and Pena Ana S
Bought by
Deguillen Araceli Cruz and Guillen Angel
Home Financials for this Owner
Home Financials are based on the most recent Mortgage that was taken out on this home.
Original Mortgage
$427,121
Interest Rate
4.16%
Mortgage Type
FHA
Purchase Details
Closed on
Jun 7, 2010
Sold by
Ameritec Investments Inc
Bought by
Betancourth Leonardo and Pena Ana S
Home Financials for this Owner
Home Financials are based on the most recent Mortgage that was taken out on this home.
Original Mortgage
$320,681
Interest Rate
5.5%
Mortgage Type
FHA
Purchase Details
Closed on
Mar 1, 2010
Sold by
Ameritec Investments Llc
Bought by
Ameritec Investments Inc
Purchase Details
Closed on
Jun 4, 2009
Sold by
Us Bank National Association
Bought by
Ameritec Investments Llc
Purchase Details
Closed on
May 23, 2009
Sold by
Johnson Andre
Bought by
Us Bank National Association
Purchase Details
Closed on
Jun 20, 2003
Sold by
New Line Development
Bought by
Sanders Robert L
Purchase Details
Closed on
Jun 19, 2003
Sold by
Green Gotha
Bought by
New Line Development Inc
Purchase Details
Closed on
Nov 4, 1999
Sold by
Jackson Cornious and Garrett Harold
Bought by
Green Gotha
Purchase Details
Closed on
Dec 9, 1998
Sold by
Essie M Hall Trust and Aurora
Bought by
Jackson Cornelius and Garrett Harold
Purchase Details
Closed on
Mar 16, 1994
Sold by
Hall Essie M
Bought by
Hall Essie M
Create a Home Valuation Report for This Property
The Home Valuation Report is an in-depth analysis detailing your home's value as well as a comparison with similar homes in the area
Home Values in the Area
Average Home Value in this Area
Purchase History
| Date | Buyer | Sale Price | Title Company |
|---|---|---|---|
| Guillen Family Trust | -- | None Listed On Document | |
| Guillen Family Trust | -- | None Listed On Document | |
| Deguillen Araceli Cruz | -- | None Listed On Document | |
| Deguillen Araceli Cruz | -- | None Listed On Document | |
| Deguillen Araceli Cruz | $435,000 | Provident Title Company | |
| Martinez Yadira | -- | Provident Title Company | |
| Deguillen Araceli Cruz | $435,000 | Provident Title Company | |
| Martinez Yadira | -- | Provident Title Company | |
| Betancourth Leonardo | $325,000 | Stewart Title Company | |
| Betancourth Leonardo | $325,000 | Stewart Title Company | |
| Ameritec Investments Inc | -- | None Available | |
| Ameritec Investments Inc | -- | None Available | |
| Ameritec Investments Llc | $155,000 | Lawyers Title | |
| Ameritec Investments Llc | $155,000 | Lawyers Title | |
| Us Bank National Association | $212,500 | Accommodation | |
| Us Bank National Association | $212,500 | Accommodation | |
| Sanders Robert L | $231,000 | Commonwealth Land Title Co | |
| Sanders Robert L | $231,000 | Commonwealth Land Title Co | |
| New Line Development Inc | $205,000 | Commonwealth Land Title Co | |
| New Line Development Inc | $205,000 | Commonwealth Land Title Co | |
| Green Gotha | $80,000 | Investors Title Company | |
| Green Gotha | $80,000 | Investors Title Company | |
| Jackson Cornelius | -- | -- | |
| Jackson Cornelius | -- | -- | |
| Hall Essie M | -- | -- | |
| Hall Essie M | -- | -- |
Source: Public Records
Mortgage History
| Date | Status | Borrower | Loan Amount |
|---|---|---|---|
| Previous Owner | Martinez Yadira | $427,121 | |
| Previous Owner | Betancourth Leonardo | $320,681 |
Source: Public Records
Tax History Compared to Growth
Tax History
| Year | Tax Paid | Tax Assessment Tax Assessment Total Assessment is a certain percentage of the fair market value that is determined by local assessors to be the total taxable value of land and additions on the property. | Land | Improvement |
|---|---|---|---|---|
| 2025 | $6,494 | $522,795 | $312,477 | $210,318 |
| 2024 | $6,494 | $512,545 | $306,350 | $206,195 |
| 2023 | $6,375 | $502,496 | $300,344 | $202,152 |
| 2022 | $6,089 | $492,644 | $294,455 | $198,189 |
| 2021 | $6,005 | $482,985 | $288,682 | $194,303 |
| 2020 | $6,063 | $478,033 | $285,722 | $192,311 |
| 2019 | $5,830 | $468,661 | $280,120 | $188,541 |
| 2018 | $5,735 | $459,473 | $274,628 | $184,845 |
| 2016 | $5,473 | $441,633 | $263,965 | $177,668 |
| 2015 | $5,395 | $435,000 | $260,000 | $175,000 |
| 2014 | $4,281 | $339,664 | $209,024 | $130,640 |
Source: Public Records
Map
Nearby Homes
- 611 W 58th St
- 731 W 54th St
- 534 W 56th St Unit 3
- 859 W 54th St
- 717 W 54th St
- 840 W 53rd St
- 529 W 56th St
- 5879 Bonsallo Ave
- 621 W 54th St
- 916 W 53rd St
- 5903 Bonsallo Ave
- 5914 S Hoover St
- 1020 W 55th St
- 5926 S Hoover St
- 437 W 58th St
- 430 W 58th St
- 937 W 52nd St
- 421 W 55th St
- 1133 W 58th St
- 420 W 53rd St