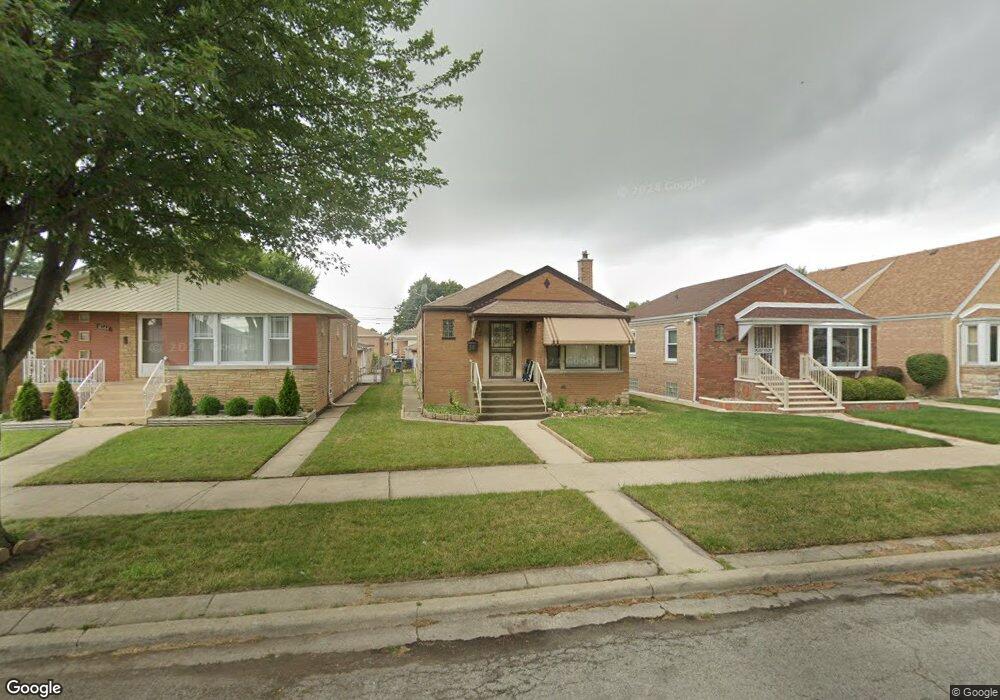
8140 S Whipple St Chicago, IL 60652
Wrightwood NeighborhoodEstimated Value: $219,000 - $279,000
2
Beds
1
Bath
971
Sq Ft
$257/Sq Ft
Est. Value
About This Home
This home is located at 8140 S Whipple St, Chicago, IL 60652 and is currently estimated at $249,916, approximately $257 per square foot. 8140 S Whipple St is a home located in Cook County with nearby schools including Carroll-Rosenwald Elementary School - Carroll Campus, Bogan Computer Technical High School, and CICS - Wrightwood.
Ownership History
Date
Name
Owned For
Owner Type
Purchase Details
Closed on
Oct 13, 2005
Sold by
Irby Clarence R and Irby Detrice R
Bought by
Irby Clarence R and Irby Detrice R
Current Estimated Value
Home Financials for this Owner
Home Financials are based on the most recent Mortgage that was taken out on this home.
Original Mortgage
$132,800
Outstanding Balance
$76,100
Interest Rate
6.9%
Mortgage Type
Balloon
Estimated Equity
$173,816
Purchase Details
Closed on
Jan 30, 1997
Sold by
Manley Bernard and Manley Joy
Bought by
Irby Clarence R and Davis Detrice R
Home Financials for this Owner
Home Financials are based on the most recent Mortgage that was taken out on this home.
Original Mortgage
$87,400
Interest Rate
8.17%
Mortgage Type
Balloon
Purchase Details
Closed on
Jul 7, 1994
Sold by
Welling George J and Welling Phyllis E
Bought by
Manley Bernard and Manley Joy
Home Financials for this Owner
Home Financials are based on the most recent Mortgage that was taken out on this home.
Original Mortgage
$85,650
Interest Rate
8.61%
Mortgage Type
Assumption
Create a Home Valuation Report for This Property
The Home Valuation Report is an in-depth analysis detailing your home's value as well as a comparison with similar homes in the area
Home Values in the Area
Average Home Value in this Area
Purchase History
| Date | Buyer | Sale Price | Title Company |
|---|---|---|---|
| Irby Clarence R | -- | Lawyers Title Insurance Corp | |
| Irby Clarence R | $92,000 | -- | |
| Manley Bernard | -- | -- |
Source: Public Records
Mortgage History
| Date | Status | Borrower | Loan Amount |
|---|---|---|---|
| Open | Irby Clarence R | $132,800 | |
| Previous Owner | Irby Clarence R | $87,400 | |
| Previous Owner | Manley Bernard | $85,650 |
Source: Public Records
Tax History Compared to Growth
Tax History
| Year | Tax Paid | Tax Assessment Tax Assessment Total Assessment is a certain percentage of the fair market value that is determined by local assessors to be the total taxable value of land and additions on the property. | Land | Improvement |
|---|---|---|---|---|
| 2024 | $3,121 | $18,000 | $2,625 | $15,375 |
| 2023 | $3,022 | $18,000 | $3,500 | $14,500 |
| 2022 | $3,022 | $18,000 | $3,500 | $14,500 |
| 2021 | $2,973 | $18,000 | $3,500 | $14,500 |
| 2020 | $2,341 | $13,522 | $3,500 | $10,022 |
| 2019 | $2,350 | $15,025 | $3,500 | $11,525 |
| 2018 | $2,309 | $15,025 | $3,500 | $11,525 |
| 2017 | $2,029 | $12,715 | $3,062 | $9,653 |
| 2016 | $2,065 | $12,715 | $3,062 | $9,653 |
| 2015 | $1,867 | $12,715 | $3,062 | $9,653 |
| 2014 | $1,824 | $12,303 | $2,843 | $9,460 |
| 2013 | $1,777 | $12,303 | $2,843 | $9,460 |
Source: Public Records
Map
Nearby Homes
- 8230 S Albany Ave
- 8232 S Sacramento Ave
- 8242 S Albany Ave
- 8034 S Sacramento Ave
- 8053 S Kedzie Ave
- 8223 S Sawyer Ave
- 8033 S Kedzie Ave
- 8118 S Spaulding Ave
- 3237 W 83rd Place
- 3030 W 85th St
- 8104 S Fairfield Ave
- 8026 S Fairfield Ave
- 2816 W 85th St
- 8054 S Washtenaw Ave
- 3433 W 82nd Place
- 3442 W 84th St
- 7826 S Christiana Ave
- 7809 S Christiana Ave
- 7756 S Spaulding Ave
- 3530 W 80th Place
- 8136 S Whipple St
- 8144 S Whipple St
- 8134 S Whipple St
- 8148 S Whipple St
- 8130 S Whipple St
- 8154 S Whipple St
- 8143 S Albany Ave
- 8126 S Whipple St
- 8139 S Albany Ave
- 8145 S Albany Ave
- 8149 S Albany Ave
- 8158 S Whipple St
- 8131 S Albany Ave
- 8151 S Albany Ave
- 8122 S Whipple St
- 8143 S Whipple St
- 8139 S Whipple St
- 8129 S Albany Ave
- 8147 S Whipple St
- 8155 S Albany Ave