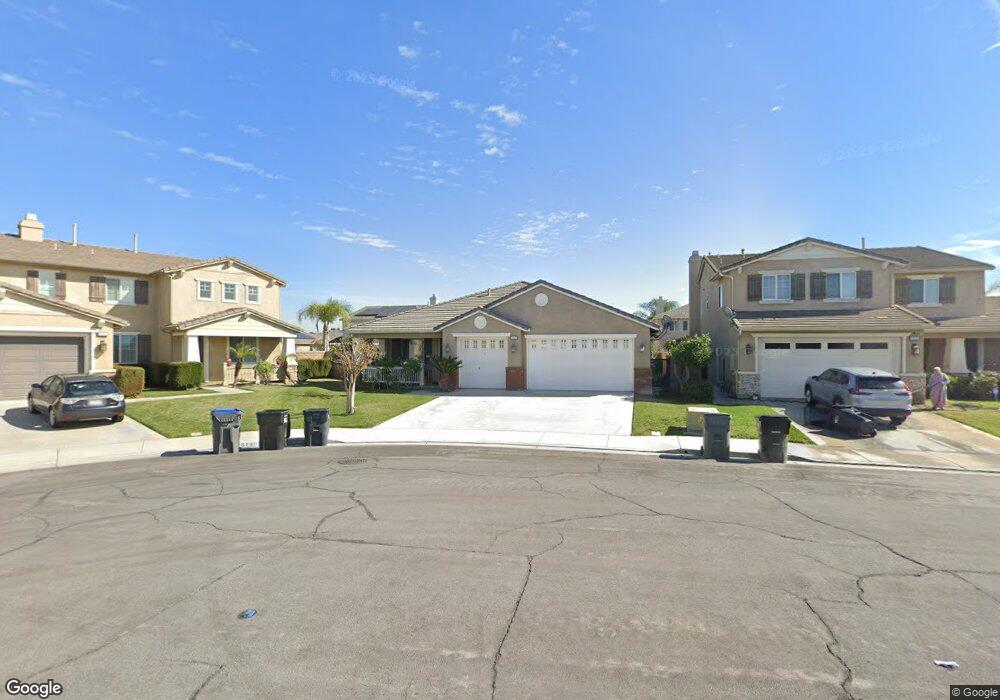
8148 Maisey Ct Corona, CA 92880
Estimated Value: $861,073 - $919,000
3
Beds
3
Baths
2,442
Sq Ft
$366/Sq Ft
Est. Value
About This Home
This home is located at 8148 Maisey Ct, Corona, CA 92880 and is currently estimated at $893,018, approximately $365 per square foot. 8148 Maisey Ct is a home located in Riverside County with nearby schools including Ronald Reagan Elementary, Dr. Augustine Ramirez Intermediate School, and Eleanor Roosevelt High School.
Ownership History
Date
Name
Owned For
Owner Type
Purchase Details
Closed on
Mar 3, 2023
Sold by
Unknown
Bought by
Ty Trust
Current Estimated Value
Purchase Details
Closed on
Aug 24, 2010
Sold by
Fannie Mae
Bought by
Young Robyn
Home Financials for this Owner
Home Financials are based on the most recent Mortgage that was taken out on this home.
Original Mortgage
$299,880
Interest Rate
4.52%
Mortgage Type
New Conventional
Purchase Details
Closed on
Mar 16, 2010
Sold by
Hurtado Octavio and Alas Veronica D
Bought by
Federal National Mortgage Association
Purchase Details
Closed on
Mar 6, 2006
Sold by
Standard Pacific Corp
Bought by
Hurtado Octavio and Alas Veronica D
Home Financials for this Owner
Home Financials are based on the most recent Mortgage that was taken out on this home.
Original Mortgage
$417,000
Interest Rate
6.09%
Mortgage Type
Purchase Money Mortgage
Create a Home Valuation Report for This Property
The Home Valuation Report is an in-depth analysis detailing your home's value as well as a comparison with similar homes in the area
Home Values in the Area
Average Home Value in this Area
Purchase History
| Date | Buyer | Sale Price | Title Company |
|---|---|---|---|
| Ty Trust | -- | -- | |
| Young Robyn | $333,500 | Old Republic Title Company | |
| Federal National Mortgage Association | $480,094 | Landsafe Title | |
| Hurtado Octavio | $539,000 | Chicago Title Company |
Source: Public Records
Mortgage History
| Date | Status | Borrower | Loan Amount |
|---|---|---|---|
| Previous Owner | Young Robyn | $299,880 | |
| Previous Owner | Hurtado Octavio | $417,000 |
Source: Public Records
Tax History Compared to Growth
Tax History
| Year | Tax Paid | Tax Assessment Tax Assessment Total Assessment is a certain percentage of the fair market value that is determined by local assessors to be the total taxable value of land and additions on the property. | Land | Improvement |
|---|---|---|---|---|
| 2025 | $7,408 | $426,869 | $140,920 | $285,949 |
| 2023 | $7,408 | $410,296 | $135,449 | $274,847 |
| 2022 | $7,211 | $402,252 | $132,794 | $269,458 |
| 2021 | $7,061 | $394,366 | $130,191 | $264,175 |
| 2020 | $6,968 | $390,324 | $128,857 | $261,467 |
| 2019 | $6,832 | $382,672 | $126,331 | $256,341 |
| 2018 | $6,718 | $375,169 | $123,854 | $251,315 |
| 2017 | $6,600 | $367,814 | $121,426 | $246,388 |
| 2016 | $6,554 | $360,603 | $119,046 | $241,557 |
| 2015 | $6,458 | $355,188 | $117,258 | $237,930 |
| 2014 | $6,398 | $348,232 | $114,962 | $233,270 |
Source: Public Records
Map
Nearby Homes
- 14253 Wolfhound St
- 8252 Ivy Springs Ct
- 7871 Slate Creek Rd
- 14145 Prairie Creek Place
- 8224 Fieldstream Ct
- 8312 Grapewin St
- 8229 Honey Brook Ct
- 7848 Orchid Dr
- 7915 Saddletree Ct
- 8330 Archibald Ave
- 14105 Almond Grove Ct
- 7846 Hall Ave
- 13879 Dearborn St
- 7882 Shoreham St
- 14871 Henry St
- 14985 Shoreham St
- 13856 Casablanca Ct
- 7311 Pinewood Ct
- 13672 Perry Ann Cir
- 7381 Citrus Valley Ave
- 8156 Maisey Ct
- 8140 Maisey Ct
- 8139 Gamebird St
- 8123 Gamebird St
- 8155 Gamebird St
- 8164 Maisey Ct
- 8133 Maisey Ct
- 8107 Gamebird St
- 8171 Gamebird St
- 14325 Wolfhound St
- 8141 Maisey Ct
- 8172 Maisey Ct
- 14333 Wolfhound St
- 8149 Maisey Ct
- 8157 Maisey Ct
- 8187 Gamebird St
- 14341 Wolfhound St
- 8091 Gamebird St
- 14326 Goose St
- 14295 Brant Ct