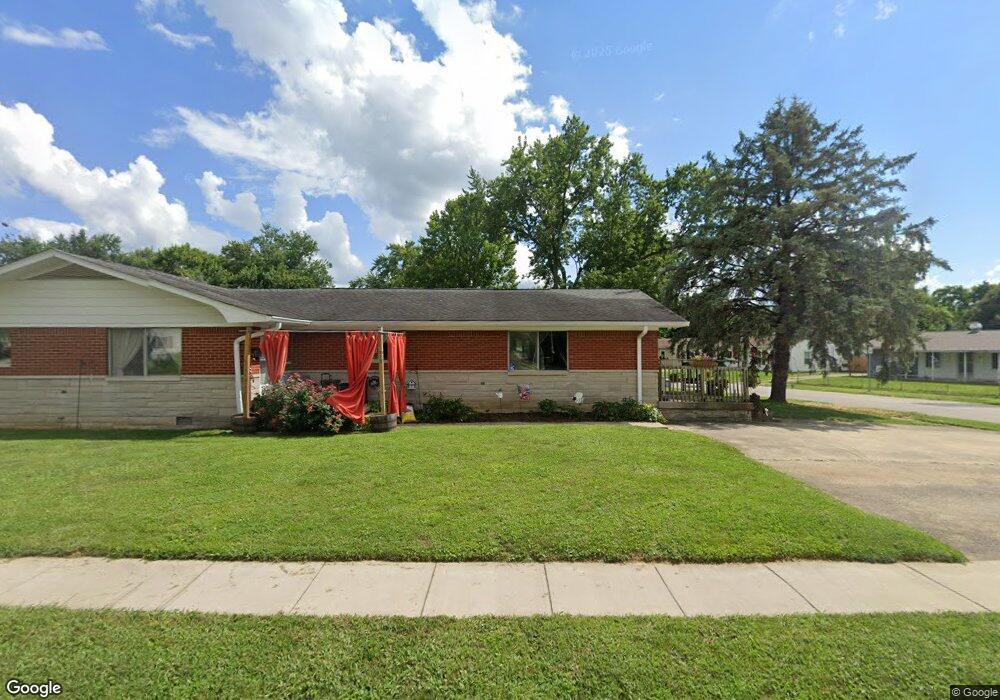
815 Highlander Dr Plainfield, IN 46168
Estimated Value: $238,615 - $257,000
4
Beds
2
Baths
1,890
Sq Ft
$129/Sq Ft
Est. Value
About This Home
This home is located at 815 Highlander Dr, Plainfield, IN 46168 and is currently estimated at $244,654, approximately $129 per square foot. 815 Highlander Dr is a home located in Hendricks County with nearby schools including Clarks Creek Elementary, Plainfield Community Middle School, and Plainfield High School.
Ownership History
Date
Name
Owned For
Owner Type
Purchase Details
Closed on
Jan 26, 2017
Sold by
Hurst Julie S
Bought by
Highlander Llc
Current Estimated Value
Purchase Details
Closed on
Oct 25, 2013
Sold by
Highlander Llc
Bought by
Hurst Julie S
Purchase Details
Closed on
Dec 11, 2007
Sold by
Hurst Julie S
Bought by
Highlander Llc
Purchase Details
Closed on
Jun 14, 2006
Sold by
Royal Properties Group Llc
Bought by
Hurst Julie
Home Financials for this Owner
Home Financials are based on the most recent Mortgage that was taken out on this home.
Original Mortgage
$21,075
Interest Rate
6.7%
Mortgage Type
Stand Alone Second
Purchase Details
Closed on
Sep 28, 2005
Sold by
Wilcox Linda
Bought by
Graves Francis D
Home Financials for this Owner
Home Financials are based on the most recent Mortgage that was taken out on this home.
Original Mortgage
$59,750
Interest Rate
5.83%
Mortgage Type
New Conventional
Create a Home Valuation Report for This Property
The Home Valuation Report is an in-depth analysis detailing your home's value as well as a comparison with similar homes in the area
Home Values in the Area
Average Home Value in this Area
Purchase History
| Date | Buyer | Sale Price | Title Company |
|---|---|---|---|
| Highlander Llc | -- | -- | |
| Hurst Julie S | -- | -- | |
| Highlander Llc | -- | None Available | |
| Hurst Julie | -- | None Available | |
| Graves Francis D | -- | None Available |
Source: Public Records
Mortgage History
| Date | Status | Borrower | Loan Amount |
|---|---|---|---|
| Previous Owner | Hurst Julie | $21,075 | |
| Previous Owner | Graves Francis D | $59,750 |
Source: Public Records
Tax History
| Year | Tax Paid | Tax Assessment Tax Assessment Total Assessment is a certain percentage of the fair market value that is determined by local assessors to be the total taxable value of land and additions on the property. | Land | Improvement |
|---|---|---|---|---|
| 2025 | $3,186 | $178,700 | $45,000 | $133,700 |
| 2024 | $3,186 | $164,300 | $30,300 | $134,000 |
| 2023 | $3,119 | $156,500 | $28,900 | $127,600 |
| 2022 | $2,430 | $121,500 | $22,300 | $99,200 |
| 2021 | $2,430 | $121,500 | $25,000 | $96,500 |
| 2020 | $2,430 | $121,500 | $22,100 | $99,400 |
| 2019 | $2,430 | $121,500 | $22,000 | $99,500 |
| 2018 | $2,342 | $117,100 | $21,300 | $95,800 |
| 2017 | $2,342 | $117,100 | $24,100 | $93,000 |
| 2016 | $2,342 | $117,100 | $25,000 | $92,100 |
| 2014 | $2,342 | $117,100 | $24,600 | $92,500 |
Source: Public Records
Map
Nearby Homes
- 942 Highlander Dr
- 2198 Galleone Way
- 7683 Fairwood Blvd
- 228 Shaw St
- 2668 Marjorie Ln
- 214 N Vine St
- 800 Walton Dr
- 911 Gary Dr
- 1042 W Main St
- 329 Avon Ave
- 100 Lincoln St
- 324 Lawndale Dr
- 4181 Baranga Dr
- 2720 Bo St W
- 5586 Gibbs Rd
- 5565 Crystal Bay West Dr
- 6608 Dunsdin Dr
- 5942 Juna Ave
- 1713 Sycamore Dr
- 4538 Redcliff South Ln
- 817 Highlander Dr
- 825 Highlander Dr
- 810 Manor Ct
- 808 Manor Ct
- 837 Highlander Dr
- 712 Roosevelt St
- 828 Manor Ct
- 804 Highlander Dr
- 814 Highlander Dr
- 826 Highlander Dr
- 204 Stafford Rd
- 849 Highlander Dr
- 710 Roosevelt St
- 838 Highlander Dr
- 846 Manor Ct
- 708 Roosevelt St
- 861 Highlander Dr
- 850 Highlander Dr
- 713 Roosevelt St
- 723 S East St
Your Personal Tour Guide
Ask me questions while you tour the home.