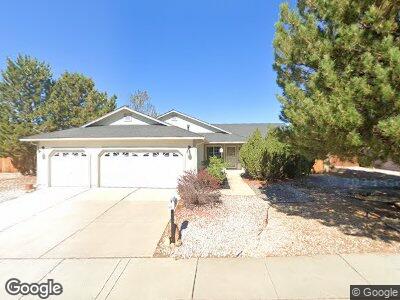
815 N University Park Loop Reno, NV 89512
West University NeighborhoodEstimated Value: $540,687 - $634,000
3
Beds
2
Baths
1,489
Sq Ft
$390/Sq Ft
Est. Value
About This Home
This home is located at 815 N University Park Loop, Reno, NV 89512 and is currently estimated at $580,922, approximately $390 per square foot. 815 N University Park Loop is a home located in Washoe County with nearby schools including Peavine Elementary School, Archie Clayton Pre-AP Academy, and Coral Academy Charter School Elementary.
Ownership History
Date
Name
Owned For
Owner Type
Purchase Details
Closed on
Jan 31, 2017
Sold by
Colvin James and Colvin Bobbie
Bought by
Durham Breck L and Fortik Connie A
Current Estimated Value
Home Financials for this Owner
Home Financials are based on the most recent Mortgage that was taken out on this home.
Original Mortgage
$272,000
Interest Rate
4.3%
Mortgage Type
New Conventional
Purchase Details
Closed on
Jul 8, 2014
Sold by
Snell Bobbie J
Bought by
Snell Bobbie J and Colvin James
Home Financials for this Owner
Home Financials are based on the most recent Mortgage that was taken out on this home.
Original Mortgage
$169,500
Interest Rate
4.07%
Mortgage Type
New Conventional
Purchase Details
Closed on
Oct 18, 2011
Sold by
Robertson Bonnie G
Bought by
Snell Bobbie J and Snell Raymond F
Home Financials for this Owner
Home Financials are based on the most recent Mortgage that was taken out on this home.
Original Mortgage
$146,197
Interest Rate
4.25%
Mortgage Type
FHA
Purchase Details
Closed on
May 10, 2006
Sold by
Johnson Lyle E and Johnson Patricia D
Bought by
Robertson Bonnie G
Home Financials for this Owner
Home Financials are based on the most recent Mortgage that was taken out on this home.
Original Mortgage
$287,200
Interest Rate
6.52%
Mortgage Type
Unknown
Purchase Details
Closed on
Aug 24, 2005
Sold by
Hibbs Bruce O and Hibbs Teresa N
Bought by
Johnson Lyle E and Johnson Patricia D
Home Financials for this Owner
Home Financials are based on the most recent Mortgage that was taken out on this home.
Original Mortgage
$271,200
Interest Rate
5%
Mortgage Type
Fannie Mae Freddie Mac
Purchase Details
Closed on
Apr 21, 2003
Sold by
Hibbs Bruce and Hibbs Teresas
Bought by
Hibbs Bruce O and Hibbs Teresa N
Home Financials for this Owner
Home Financials are based on the most recent Mortgage that was taken out on this home.
Original Mortgage
$176,000
Interest Rate
5.79%
Purchase Details
Closed on
Mar 24, 2003
Sold by
Usher John A and Usher Colleen M
Bought by
Hibbs Bruce O and Hibbs Teresa N
Home Financials for this Owner
Home Financials are based on the most recent Mortgage that was taken out on this home.
Original Mortgage
$176,000
Interest Rate
5.79%
Purchase Details
Closed on
Nov 30, 1993
Sold by
Ridgeland Land Co
Bought by
Usher John A and Usher Colleen M
Home Financials for this Owner
Home Financials are based on the most recent Mortgage that was taken out on this home.
Original Mortgage
$137,608
Interest Rate
6.74%
Mortgage Type
VA
Create a Home Valuation Report for This Property
The Home Valuation Report is an in-depth analysis detailing your home's value as well as a comparison with similar homes in the area
Home Values in the Area
Average Home Value in this Area
Purchase History
| Date | Buyer | Sale Price | Title Company |
|---|---|---|---|
| Durham Breck L | $340,000 | First Centennial Reno | |
| Snell Bobbie J | $226,000 | North American Title | |
| Snell Bobbie J | $150,000 | Capital Title Company Of Nv | |
| Robertson Bonnie G | $359,000 | Ticor Title Of Nevada Inc | |
| Johnson Lyle E | $339,000 | Ticor Title Of Nevada Inc | |
| Hibbs Bruce O | -- | -- | |
| Hibbs Bruce O | $220,000 | Inter County Title Co | |
| Usher John A | $134,000 | Western Title Company Inc |
Source: Public Records
Mortgage History
| Date | Status | Borrower | Loan Amount |
|---|---|---|---|
| Open | Durham Breck L | $237,000 | |
| Closed | Durham Breck L | $261,725 | |
| Previous Owner | Durham Breck L | $272,000 | |
| Previous Owner | Colvin James R | $96,500 | |
| Previous Owner | Snell Bobbie J | $169,500 | |
| Previous Owner | Snell Bobbie J | $146,197 | |
| Previous Owner | Robertson Bonnie G | $287,200 | |
| Previous Owner | Johnson Lyle E | $271,200 | |
| Previous Owner | Hibbs Bruce O | $176,000 | |
| Previous Owner | Usher John A | $137,608 |
Source: Public Records
Tax History Compared to Growth
Tax History
| Year | Tax Paid | Tax Assessment Tax Assessment Total Assessment is a certain percentage of the fair market value that is determined by local assessors to be the total taxable value of land and additions on the property. | Land | Improvement |
|---|---|---|---|---|
| 2025 | $2,129 | $95,546 | $42,327 | $53,219 |
| 2024 | $2,129 | $95,855 | $42,000 | $53,855 |
| 2023 | $2,067 | $95,054 | $43,750 | $51,304 |
| 2022 | $2,008 | $76,492 | $33,565 | $42,928 |
| 2021 | $1,949 | $66,856 | $23,940 | $42,916 |
| 2020 | $1,892 | $69,132 | $25,935 | $43,197 |
| 2019 | $1,836 | $66,912 | $24,938 | $41,974 |
| 2018 | $1,805 | $62,896 | $21,613 | $41,283 |
| 2017 | $1,731 | $58,957 | $17,456 | $41,501 |
| 2016 | $1,686 | $58,709 | $16,293 | $42,416 |
| 2015 | $1,684 | $57,570 | $14,963 | $42,607 |
| 2014 | $1,634 | $52,866 | $11,604 | $41,262 |
| 2013 | -- | $43,227 | $8,579 | $34,648 |
Source: Public Records
Map
Nearby Homes
- 3620 Pimlico St
- 3611 Oaklawn St
- 3665 Coastal St
- 3684 Remington Park Dr
- 1006 University Place
- 1095 S University Park Loop
- 925 Morrill Hall Ct
- 100 Bisset Ct Unit B
- 200 Talus Way Unit 123
- 200 Talus Way Unit 522
- 200 Talus Way Unit 232
- 200 Talus Way Unit 324
- 140 Griswold Way
- 905 Demos Ct
- 3905 Covington Way Unit A
- 3945 Covington Way Unit B
- 935 Demos Ct
- 2528 Comstock Dr
- 18 Colombard Way
- 27 Chianti Way
- 815 N University Park Loop
- 805 N University Park Loop
- 825 N University Park Loop
- 3540 Socrates Dr
- 3485 University Green Dr
- 835 N University Park Loop
- 3510 Socrates Dr
- 3550 Socrates Dr
- 846 N University Park Loop
- 845 N University Park Loop
- 3500 Socrates Dr Unit 2
- 3475 University Green Dr
- 3675 Sienna Summit Ct
- 790 Sienna Station Way
- 3560 Socrates Dr
- 3465 Socrates Dr
- 3475 Socrates Dr
- 905 University Green Ct
- 856 N University Park Loop
- 3570 Socrates Dr