
Seller's Agent in 2021
Marcia Goodman
Samson Properties
(703) 819-4776
26 Total Sales
Estimated Value: $348,000 - $359,186
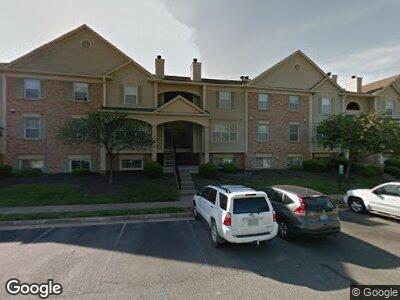
Sought After Historic Manassas Condo! So close to everything you need including I66, VRE, Costco, and other shopping and dining!!! Inviting and covered entrance to front. Gorgeous main level with chair railing and crown molding in the Living Room and Dining Room. Spacious and open kitchen with breakfast nook and a cutout view. Large Living Room with wood burning fireplace and lots of natural light from walls of large windows! Separate dining Room / table space with sliding door to covered balcony. Kitchen has stainless appliances. Laundry room with washer and dryer upper level. Down the hall to two primary bedrooms with large walk-in closets and each with it's own private bath. 2 parking passes and 1 guest pass. Great commuting including the train stations and major highways. 4 miles to the hospital, 5 miles to downtown (entertainment, dining, shopping, and the train station). Historic Manassas has lots of events including First Friday events, sip and shop, holiday festivities, farmers market, breweries, roof-top bars/restaurants, gift shops, specialty restaurants. Come and see for yourself all there is to do!
| Date | Status | Borrower | Loan Amount |
|---|---|---|---|
| Closed | Nash Joyce B | $135,000 |
| Date | Event | Price | Change | Sq Ft Price |
|---|---|---|---|---|
| 12/27/2021 12/27/21 | Rented | $1,800 | 0.0% | -- |
| 12/11/2021 12/11/21 | Under Contract | -- | -- | -- |
| 12/03/2021 12/03/21 | For Rent | $1,800 | +2.9% | -- |
| 09/01/2021 09/01/21 | Rented | $1,750 | 0.0% | -- |
| 08/30/2021 08/30/21 | Under Contract | -- | -- | -- |
| 08/24/2021 08/24/21 | For Rent | $1,750 | +25.0% | -- |
| 08/29/2014 08/29/14 | Rented | $1,400 | 0.0% | -- |
| 08/25/2014 08/25/14 | Under Contract | -- | -- | -- |
| 08/18/2014 08/18/14 | For Rent | $1,400 | -- | -- |
| Year | Tax Paid | Tax Assessment Tax Assessment Total Assessment is a certain percentage of the fair market value that is determined by local assessors to be the total taxable value of land and additions on the property. | Land | Improvement |
|---|---|---|---|---|
| 2024 | $3,191 | $320,900 | $79,500 | $241,400 |
| 2023 | $3,080 | $296,000 | $73,100 | $222,900 |
| 2022 | $2,819 | $254,500 | $62,800 | $191,700 |
| 2021 | $2,741 | $222,500 | $62,800 | $159,700 |
| 2020 | $3,218 | $207,600 | $48,000 | $159,600 |
| 2019 | $3,173 | $204,700 | $48,000 | $156,700 |
| 2018 | $2,363 | $195,700 | $48,000 | $147,700 |
| 2017 | $2,171 | $173,600 | $45,900 | $127,700 |
| 2016 | $2,232 | $180,400 | $45,900 | $134,500 |
| 2015 | $2,100 | $181,400 | $45,900 | $135,500 |
| 2014 | $2,100 | $165,800 | $41,800 | $124,000 |
Seller's Agent in 2021
Marcia Goodman
Samson Properties
(703) 819-4776
26 Total Sales
d
Buyer's Agent in 2021
datacorrect BrightMLS
Non Subscribing Office
Buyer's Agent in 2021
Syed Almansur
Move4Free Realty, LLC
(703) 597-7067
8 Total Sales
Seller's Agent in 2014
Mary Tobin
Samson Properties
(703) 477-1004
Buyer's Agent in 2014
Juliette Burke
BHHS PenFed (actual)
(703) 396-6000