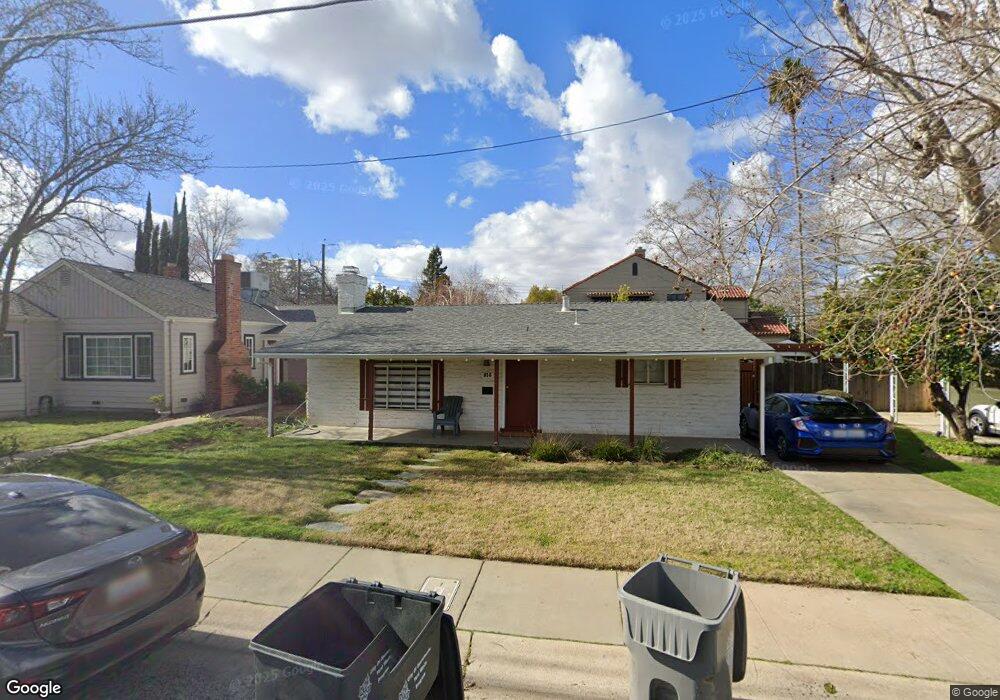
816 50th St Sacramento, CA 95819
East Sacramento NeighborhoodEstimated Value: $588,384 - $817,000
2
Beds
1
Bath
1,487
Sq Ft
$472/Sq Ft
Est. Value
About This Home
This home is located at 816 50th St, Sacramento, CA 95819 and is currently estimated at $701,346, approximately $471 per square foot. 816 50th St is a home located in Sacramento County with nearby schools including Caleb Greenwood Elementary, Miwok Middle School, and Hiram W. Johnson High School.
Ownership History
Date
Name
Owned For
Owner Type
Purchase Details
Closed on
Sep 4, 2014
Sold by
Mullen Michael James
Bought by
The Michael J & Carla Mullen Revocable T
Current Estimated Value
Home Financials for this Owner
Home Financials are based on the most recent Mortgage that was taken out on this home.
Original Mortgage
$136,000
Interest Rate
4.09%
Mortgage Type
New Conventional
Purchase Details
Closed on
Apr 23, 2009
Sold by
Mullen Michael J and Dorothy E Mullen Revocable Tru
Bought by
Mullen Michael James
Purchase Details
Closed on
May 25, 2004
Sold by
Mullen Dorothy E and Dorothy E Mullen Revocable Tru
Bought by
Mullen Michael J and Dorothy E Mullen Revocable Tru
Home Financials for this Owner
Home Financials are based on the most recent Mortgage that was taken out on this home.
Original Mortgage
$150,000
Interest Rate
5.77%
Mortgage Type
Credit Line Revolving
Create a Home Valuation Report for This Property
The Home Valuation Report is an in-depth analysis detailing your home's value as well as a comparison with similar homes in the area
Home Values in the Area
Average Home Value in this Area
Purchase History
| Date | Buyer | Sale Price | Title Company |
|---|---|---|---|
| The Michael J & Carla Mullen Revocable T | -- | Title Resources Guaranty Co | |
| Mullen Michael James | -- | None Available | |
| Mullen Michael J | -- | -- |
Source: Public Records
Mortgage History
| Date | Status | Borrower | Loan Amount |
|---|---|---|---|
| Closed | The Michael J & Carla Mullen Revocable T | $136,000 | |
| Closed | Mullen Michael J | $150,000 |
Source: Public Records
Tax History Compared to Growth
Tax History
| Year | Tax Paid | Tax Assessment Tax Assessment Total Assessment is a certain percentage of the fair market value that is determined by local assessors to be the total taxable value of land and additions on the property. | Land | Improvement |
|---|---|---|---|---|
| 2025 | $862 | $65,147 | $17,435 | $47,712 |
| 2024 | $862 | $63,871 | $17,094 | $46,777 |
| 2023 | $842 | $62,619 | $16,759 | $45,860 |
| 2022 | $827 | $61,392 | $16,431 | $44,961 |
| 2021 | $789 | $60,189 | $16,109 | $44,080 |
| 2020 | $793 | $59,573 | $15,944 | $43,629 |
| 2019 | $777 | $58,406 | $15,632 | $42,774 |
| 2018 | $756 | $57,262 | $15,326 | $41,936 |
| 2017 | $745 | $56,140 | $15,026 | $41,114 |
| 2016 | $732 | $55,040 | $14,732 | $40,308 |
| 2015 | $721 | $54,214 | $14,511 | $39,703 |
| 2014 | $704 | $53,157 | $14,228 | $38,929 |
Source: Public Records
Map
Nearby Homes