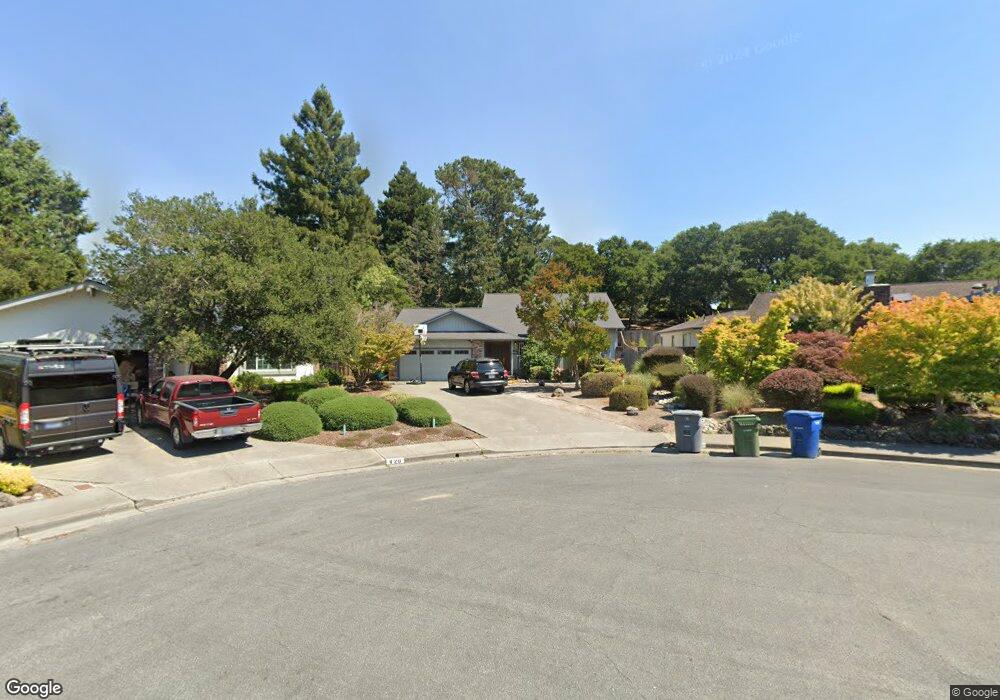
816 Cindy Ln Petaluma, CA 94952
Oakhill Brewster NeighborhoodEstimated Value: $966,010 - $1,241,000
3
Beds
2
Baths
1,863
Sq Ft
$594/Sq Ft
Est. Value
About This Home
This home is located at 816 Cindy Ln, Petaluma, CA 94952 and is currently estimated at $1,106,753, approximately $594 per square foot. 816 Cindy Ln is a home located in Sonoma County with nearby schools including McKinley Elementary School, Petaluma Junior High School, and Petaluma High School.
Ownership History
Date
Name
Owned For
Owner Type
Purchase Details
Closed on
Sep 15, 2025
Sold by
Santini Gregory and Santini Marissa
Bought by
Marilynn J Thompson Trust and Santini
Current Estimated Value
Home Financials for this Owner
Home Financials are based on the most recent Mortgage that was taken out on this home.
Original Mortgage
$130,000
Outstanding Balance
$130,000
Interest Rate
6.72%
Mortgage Type
New Conventional
Estimated Equity
$976,753
Purchase Details
Closed on
Dec 21, 2001
Sold by
Santini Marilynn J
Bought by
Thompson Marilynn J and Marilynn J Thompson Trust
Purchase Details
Closed on
Apr 26, 1996
Sold by
Thompson Adelene
Bought by
Santini Marilynn J
Purchase Details
Closed on
Apr 13, 1993
Sold by
Santini Paul F
Bought by
Santini Marilynn J
Create a Home Valuation Report for This Property
The Home Valuation Report is an in-depth analysis detailing your home's value as well as a comparison with similar homes in the area
Home Values in the Area
Average Home Value in this Area
Purchase History
| Date | Buyer | Sale Price | Title Company |
|---|---|---|---|
| Marilynn J Thompson Trust | -- | Old Republic Title Company | |
| Santini Gregory | -- | Old Republic Title Company | |
| Thompson Marilynn J | -- | -- | |
| Santini Marilynn J | -- | -- | |
| Santini Marilynn J | -- | -- |
Source: Public Records
Mortgage History
| Date | Status | Borrower | Loan Amount |
|---|---|---|---|
| Open | Santini Gregory | $130,000 |
Source: Public Records
Tax History
| Year | Tax Paid | Tax Assessment Tax Assessment Total Assessment is a certain percentage of the fair market value that is determined by local assessors to be the total taxable value of land and additions on the property. | Land | Improvement |
|---|---|---|---|---|
| 2025 | $3,461 | $306,953 | $76,183 | $230,770 |
| 2024 | $3,461 | $300,936 | $74,690 | $226,246 |
| 2023 | $3,461 | $295,036 | $73,226 | $221,810 |
| 2022 | $3,306 | $289,252 | $71,791 | $217,461 |
| 2021 | $3,246 | $283,582 | $70,384 | $213,198 |
| 2020 | $3,273 | $280,675 | $69,663 | $211,012 |
| 2019 | $3,234 | $275,173 | $68,298 | $206,875 |
| 2018 | $3,222 | $269,778 | $66,959 | $202,819 |
| 2017 | $3,156 | $264,490 | $65,647 | $198,843 |
| 2016 | $3,078 | $259,305 | $64,360 | $194,945 |
| 2015 | $3,036 | $255,411 | $63,394 | $192,017 |
| 2014 | $3,022 | $250,409 | $62,153 | $188,256 |
Source: Public Records
Map
Nearby Homes
Your Personal Tour Guide
Ask me questions while you tour the home.