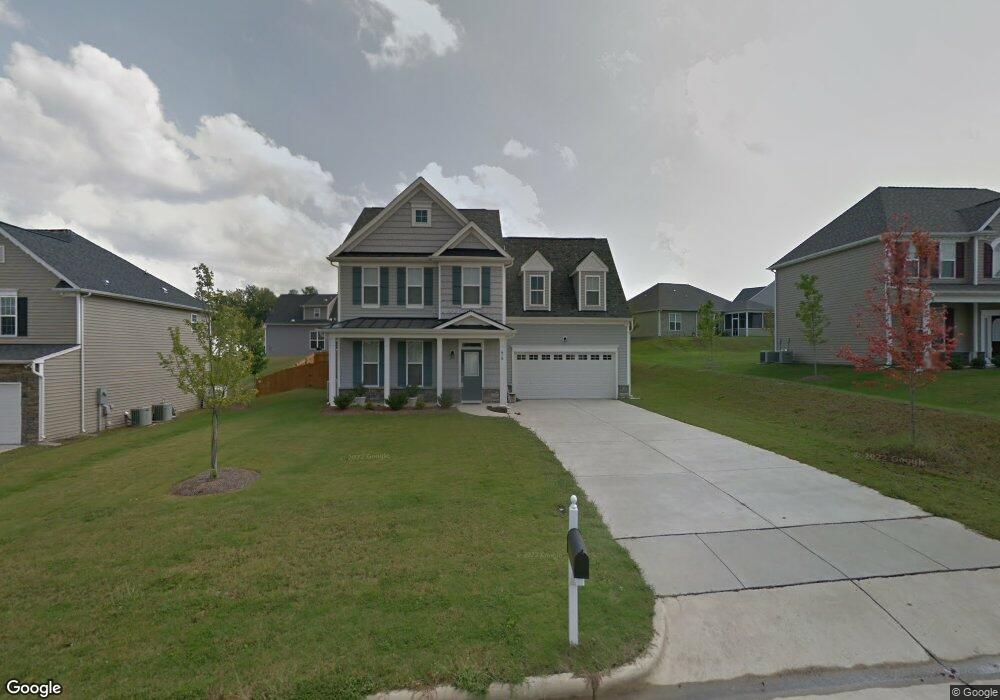
816 Maurepas Dr Knightdale, NC 27545
Estimated Value: $389,863 - $413,000
4
Beds
3
Baths
2,235
Sq Ft
$179/Sq Ft
Est. Value
About This Home
This home is located at 816 Maurepas Dr, Knightdale, NC 27545 and is currently estimated at $400,716, approximately $179 per square foot. 816 Maurepas Dr is a home located in Wake County with nearby schools including Hodge Road Elementary School, Neuse River Middle School, and Knightdale High.
Ownership History
Date
Name
Owned For
Owner Type
Purchase Details
Closed on
Mar 14, 2018
Sold by
White Brian T and White Dayna
Bought by
Farmer Mary Katherine
Current Estimated Value
Home Financials for this Owner
Home Financials are based on the most recent Mortgage that was taken out on this home.
Original Mortgage
$190,400
Outstanding Balance
$162,535
Interest Rate
4.22%
Mortgage Type
New Conventional
Estimated Equity
$238,181
Purchase Details
Closed on
Dec 13, 2013
Sold by
Dlw Properties Llc
Bought by
White Brian T
Home Financials for this Owner
Home Financials are based on the most recent Mortgage that was taken out on this home.
Original Mortgage
$156,061
Interest Rate
4.13%
Mortgage Type
New Conventional
Purchase Details
Closed on
Feb 28, 2011
Sold by
Fsc Iii Llc
Bought by
Dlw Properties Llc
Purchase Details
Closed on
May 1, 2010
Sold by
Fred Smith Company
Bought by
Fsc Iii Llc
Create a Home Valuation Report for This Property
The Home Valuation Report is an in-depth analysis detailing your home's value as well as a comparison with similar homes in the area
Home Values in the Area
Average Home Value in this Area
Purchase History
| Date | Buyer | Sale Price | Title Company |
|---|---|---|---|
| Farmer Mary Katherine | $238,000 | None Available | |
| White Brian T | $150,000 | None Available | |
| Dlw Properties Llc | $175,000 | None Available | |
| Fsc Iii Llc | -- | None Available |
Source: Public Records
Mortgage History
| Date | Status | Borrower | Loan Amount |
|---|---|---|---|
| Open | Farmer Mary Katherine | $190,400 | |
| Previous Owner | White Brian T | $156,061 |
Source: Public Records
Tax History Compared to Growth
Tax History
| Year | Tax Paid | Tax Assessment Tax Assessment Total Assessment is a certain percentage of the fair market value that is determined by local assessors to be the total taxable value of land and additions on the property. | Land | Improvement |
|---|---|---|---|---|
| 2025 | $3,783 | $393,122 | $85,000 | $308,122 |
| 2024 | $3,768 | $393,122 | $85,000 | $308,122 |
| 2023 | $2,907 | $260,826 | $40,000 | $220,826 |
| 2022 | $2,810 | $260,826 | $40,000 | $220,826 |
| 2021 | $2,680 | $260,826 | $40,000 | $220,826 |
| 2020 | $2,680 | $260,826 | $40,000 | $220,826 |
| 2019 | $2,311 | $199,053 | $40,000 | $159,053 |
| 2018 | $2,179 | $199,053 | $40,000 | $159,053 |
| 2017 | $2,100 | $199,053 | $40,000 | $159,053 |
| 2016 | $2,071 | $199,053 | $40,000 | $159,053 |
| 2015 | $2,093 | $198,480 | $42,000 | $156,480 |
| 2014 | $2,021 | $198,480 | $42,000 | $156,480 |
Source: Public Records
Map
Nearby Homes
- 1010 Hadel Place
- 114 Montview Way
- 1308 Plexor Ln
- 910 Savin Landing
- 907 Savin Landing
- 4809 Smarty Jones Dr
- 1122 Delham Rd
- 1006 Trail Stream Way
- 1214 Delham Rd
- 4707 Smarty Jones Dr
- 1209 Agile Dr
- 4611 Dr
- 1007 Olde Midway Ct
- 2523 Ferdinand Dr
- 2111 Old Rosebud Dr
- 1227 Sunday Silence Dr
- 4013 Twin Spires Dr
- 1508 Hodge Rd
- 1001 Tarford Place
- 1101 Redwood Valley Ln
- 818 Maurepas Dr
- 807 Derwent Place
- 809 Derwent Place
- 805 Derwent Place
- 812 Maurepas Dr
- 820 Maurepas Dr
- 817 Maurepas Dr
- 815 Maurepas Dr
- 811 Derwent Place
- 819 Maurepas Dr
- 803 Derwent Place
- 813 Maurepas Dr
- 806 Maurepas Dr
- 824 Maurepas Dr
- 821 Maurepas Dr
- 813 Derwent Place
- 811 Maurepas Dr
- 801 Derwent Place
- 806 Derwent Place
- 504 Bellefont Ct