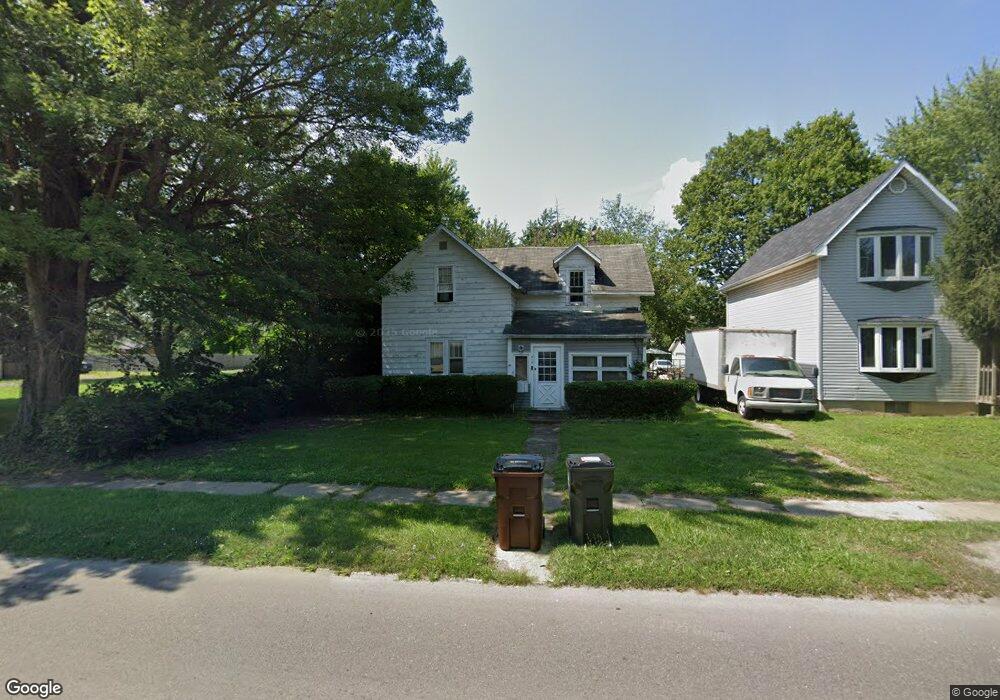
816 S Main St Kenton, OH 43326
Estimated Value: $85,000 - $134,000
2
Beds
2
Baths
1,648
Sq Ft
$70/Sq Ft
Est. Value
About This Home
This home is located at 816 S Main St, Kenton, OH 43326 and is currently estimated at $114,646, approximately $69 per square foot. 816 S Main St is a home located in Hardin County with nearby schools including Kenton Elementary School, Kenton Middle School, and Kenton High School.
Ownership History
Date
Name
Owned For
Owner Type
Purchase Details
Closed on
Jul 27, 2005
Sold by
Tiger Relocation Co
Bought by
Bur Mac Development Corp
Current Estimated Value
Purchase Details
Closed on
May 5, 2004
Bought by
Tiger Relocation Co
Purchase Details
Closed on
Feb 20, 2004
Bought by
Steele Loretta Jean
Purchase Details
Closed on
Apr 28, 1993
Bought by
Steele Gail R and Steele Loretta
Purchase Details
Closed on
Nov 6, 1992
Create a Home Valuation Report for This Property
The Home Valuation Report is an in-depth analysis detailing your home's value as well as a comparison with similar homes in the area
Home Values in the Area
Average Home Value in this Area
Purchase History
| Date | Buyer | Sale Price | Title Company |
|---|---|---|---|
| Bur Mac Development Corp | $32,000 | -- | |
| Tiger Relocation Co | -- | -- | |
| Steele Loretta Jean | -- | -- | |
| Steele Gail R | -- | -- | |
| -- | -- | -- |
Source: Public Records
Tax History Compared to Growth
Tax History
| Year | Tax Paid | Tax Assessment Tax Assessment Total Assessment is a certain percentage of the fair market value that is determined by local assessors to be the total taxable value of land and additions on the property. | Land | Improvement |
|---|---|---|---|---|
| 2024 | $1,162 | $25,980 | $2,120 | $23,860 |
| 2023 | $1,162 | $25,980 | $2,120 | $23,860 |
| 2022 | $1,206 | $25,340 | $1,480 | $23,860 |
| 2021 | $1,210 | $25,340 | $1,480 | $23,860 |
| 2020 | $1,238 | $25,340 | $1,480 | $23,860 |
| 2019 | $1,152 | $25,270 | $1,410 | $23,860 |
| 2018 | $1,195 | $25,270 | $1,410 | $23,860 |
| 2017 | $1,027 | $25,270 | $1,410 | $23,860 |
| 2016 | $881 | $20,160 | $1,550 | $18,610 |
| 2015 | $746 | $20,160 | $1,550 | $18,610 |
| 2014 | $6,626 | $20,160 | $1,550 | $18,610 |
| 2013 | $3,840 | $22,190 | $1,550 | $20,640 |
Source: Public Records
Map
Nearby Homes
- 727 S Detroit St
- 639 S Main St
- 320 Letson Ave
- 508 Decatur St
- 510 Decatur St
- 121 S High St
- 920 Cooper St
- 530 E Franklin St
- 513 E Franklin St
- 115 Scioto St
- 39 Grape St
- 219 W Carrol St
- 79 Broadway St
- 509 E Carrol St
- 215 N Main St
- 233 N Main St
- 726 Tracy St
- 310 N Market St
- 702 W Franklin St Unit 702 1/2
- 328 N Detroit St