Estimated Value: $429,000 - $549,773
3
Beds
3
Baths
1,973
Sq Ft
$250/Sq Ft
Est. Value
About This Home
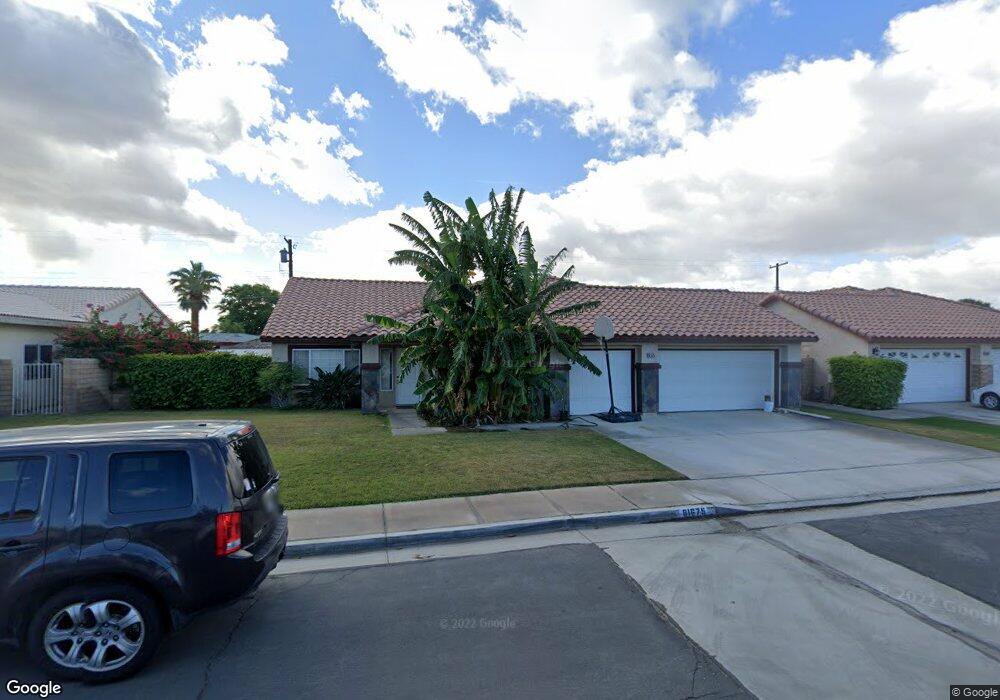
This home is located at 81675 Angela Ct, Indio, CA 92201 and is currently estimated at $493,193, approximately $249 per square foot. 81675 Angela Ct is a home located in Riverside County with nearby schools including John F. Kennedy Elementary School, Indio Middle School, and Indio High School.
Ownership History
Date
Name
Owned For
Owner Type
Purchase Details
Closed on
Feb 14, 2007
Sold by
Flores Manuel and Flores Dora A
Bought by
Flores Dora A
Current Estimated Value
Home Financials for this Owner
Home Financials are based on the most recent Mortgage that was taken out on this home.
Original Mortgage
$261,446
Outstanding Balance
$157,030
Interest Rate
6.21%
Mortgage Type
Purchase Money Mortgage
Estimated Equity
$336,163
Purchase Details
Closed on
Dec 27, 2001
Sold by
Jurgensen Jay Christian and Jurgensen Nancy Patricia
Bought by
Flores Manuel and Flores Dora A
Home Financials for this Owner
Home Financials are based on the most recent Mortgage that was taken out on this home.
Original Mortgage
$195,000
Interest Rate
7.01%
Purchase Details
Closed on
May 5, 1997
Sold by
Pacific National Bank
Bought by
Jurgensen Jay Christian and Jurgensen Nancy Patricia
Home Financials for this Owner
Home Financials are based on the most recent Mortgage that was taken out on this home.
Original Mortgage
$90,000
Interest Rate
8.14%
Create a Home Valuation Report for This Property
The Home Valuation Report is an in-depth analysis detailing your home's value as well as a comparison with similar homes in the area
Home Values in the Area
Average Home Value in this Area
Purchase History
We collect this data history from publicly available records. To have your information removed, we recommend requesting removal directly through your county’s website.
| Date | Buyer | Sale Price | Title Company |
|---|---|---|---|
| Flores Dora A | $98,000 | Multiple | |
| Flores Manuel | $195,000 | American Title | |
| Jurgensen Jay Christian | $124,000 | Chicago Title Co |
Source: Public Records
Mortgage History
We collect this data history from publicly available records. To have your information removed, we recommend requesting removal directly through your county’s website.
| Date | Status | Borrower | Loan Amount |
|---|---|---|---|
| Open | Flores Dora A | $261,446 | |
| Closed | Flores Manuel | $195,000 | |
| Previous Owner | Jurgensen Jay Christian | $90,000 |
Source: Public Records
Tax History
| Year | Tax Paid | Tax Assessment Tax Assessment Total Assessment is a certain percentage of the fair market value that is determined by local assessors to be the total taxable value of land and additions on the property. | Land | Improvement |
|---|---|---|---|---|
| 2025 | $4,641 | $288,046 | $66,463 | $221,583 |
| 2023 | $4,641 | $276,863 | $63,883 | $212,980 |
| 2022 | $4,311 | $271,435 | $62,631 | $208,804 |
| 2021 | $4,203 | $266,113 | $61,403 | $204,710 |
| 2020 | $3,887 | $263,385 | $60,774 | $202,611 |
| 2019 | $3,797 | $258,222 | $59,583 | $198,639 |
| 2018 | $3,712 | $253,160 | $58,415 | $194,745 |
| 2017 | $3,647 | $248,197 | $57,270 | $190,927 |
| 2016 | $3,584 | $243,332 | $56,148 | $187,184 |
| 2015 | $3,548 | $239,678 | $55,305 | $184,373 |
| 2014 | $3,494 | $234,985 | $54,223 | $180,762 |
Source: Public Records
Map
Nearby Homes
- 45546 Aladdin St Unit B101
- 45546 Aladdin St Unit A101
- 45546 Aladdin St Unit C202
- 45751 Aladdin St
- 44593 Roundtable St
- 82012 Sierra Ave
- 81452 Helen Ave
- 81402 Palmwood Dr
- 45890 San Gabriel St
- 81369 Alberta Ave
- 0 Monroe St Unit 219141652PS
- 81255 Palm Meadows Dr
- 82245 Sierra Ave
- 81790 Armata St
- 81351 Avenue 46 Unit 64
- 82950 California 111
- 81143 Palmwood Dr
- 82180 Valencia Ave
- 81729 California 111
- 0 NW Fred Waring Hoover St Unit 219102015DA
- 81689 Angela Ct
- 81659 Angela Ct
- 81704 Lido Ave
- 81718 Lido Ave
- 81690 Lido Ave
- 45194 Bradley Way
- 81707 Angela Ct
- 81641 Angela Ct
- 81732 Lido Ave
- 45195 Bradley Way
- 81676 Lido Ave
- 45166 Bradley Way
- 45167 Bradley Way
- 81719 Angela Ct
- 81746 Lido Ave
- 45194 Tomlyn Way
- 81662 Lido Ave
- 81706 Angela Ct
- 81705 Lido Ave
- 81719 Lido Ave
Your Personal Tour Guide
Ask me questions while you tour the home.