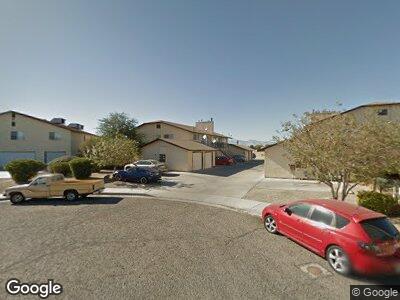
817 Capehart Ct Unit A Ridgecrest, CA 93555
Estimated Value: $423,198 - $689,000
3
Beds
2
Baths
1,147
Sq Ft
$477/Sq Ft
Est. Value
About This Home
This home is located at 817 Capehart Ct Unit A, Ridgecrest, CA 93555 and is currently estimated at $546,550, approximately $476 per square foot. 817 Capehart Ct Unit A is a home located in Kern County with nearby schools including Las Flores Elementary School, James Monroe Middle School, and Burroughs High School.
Ownership History
Date
Name
Owned For
Owner Type
Purchase Details
Closed on
Jun 9, 2017
Sold by
Moore Robert V
Bought by
Leblanc Nick
Current Estimated Value
Purchase Details
Closed on
May 2, 2017
Sold by
Moore Maria J and Moore Maria Jose Limpo De Mesquita B
Bought by
Moore Robert V
Purchase Details
Closed on
Jul 1, 2002
Sold by
Logan Janet A
Bought by
Moore Robert V and Moore Maria J
Home Financials for this Owner
Home Financials are based on the most recent Mortgage that was taken out on this home.
Original Mortgage
$98,400
Interest Rate
6.78%
Purchase Details
Closed on
Feb 7, 2001
Sold by
Bank Of Stockdale
Bought by
Logan Janet A
Home Financials for this Owner
Home Financials are based on the most recent Mortgage that was taken out on this home.
Original Mortgage
$54,250
Interest Rate
7.15%
Purchase Details
Closed on
Mar 26, 1996
Sold by
Associated Ridgecrest Ltd I
Bought by
Bank Of Stockdale Fsb
Create a Home Valuation Report for This Property
The Home Valuation Report is an in-depth analysis detailing your home's value as well as a comparison with similar homes in the area
Home Values in the Area
Average Home Value in this Area
Purchase History
| Date | Buyer | Sale Price | Title Company |
|---|---|---|---|
| Leblanc Nick | $295,000 | Chicago Title Company | |
| Moore Robert V | -- | Chicago Title Company | |
| Moore Robert V | $124,500 | Chicago Title Co | |
| Logan Janet A | $77,500 | Commonwealth Land Title Co | |
| Bank Of Stockdale Fsb | $815,237 | Chicago Title |
Source: Public Records
Mortgage History
| Date | Status | Borrower | Loan Amount |
|---|---|---|---|
| Open | Leblanc Nicholas | $212,500 | |
| Closed | Leblanc Nick | $213,500 | |
| Previous Owner | Moore Robert V | $98,400 | |
| Previous Owner | Logan Janet A | $54,250 | |
| Closed | Moore Robert V | $12,300 |
Source: Public Records
Tax History Compared to Growth
Tax History
| Year | Tax Paid | Tax Assessment Tax Assessment Total Assessment is a certain percentage of the fair market value that is determined by local assessors to be the total taxable value of land and additions on the property. | Land | Improvement |
|---|---|---|---|---|
| 2024 | $5,506 | $329,073 | $55,774 | $273,299 |
| 2023 | $5,506 | $322,622 | $54,681 | $267,941 |
| 2022 | $5,394 | $316,297 | $53,609 | $262,688 |
| 2021 | $5,139 | $310,096 | $52,558 | $257,538 |
| 2020 | $4,992 | $306,918 | $52,020 | $254,898 |
| 2019 | $4,926 | $306,918 | $52,020 | $254,898 |
| 2018 | $4,852 | $295,000 | $50,000 | $245,000 |
| 2017 | $3,364 | $155,354 | $24,952 | $130,402 |
| 2016 | $3,253 | $152,309 | $24,463 | $127,846 |
| 2015 | $3,196 | $150,022 | $24,096 | $125,926 |
| 2014 | $2,797 | $147,084 | $23,624 | $123,460 |
Source: Public Records
Map
Nearby Homes
- 925 W Tamarisk Ave Unit B
- 653 Rio Bravo St Unit A
- 0 N Downs St
- 0 N Inyo St
- 649 La Paloma St
- 1116 W Tamarisk Ave
- 948 W Vicki Ave
- 1105 Rebecca Ave
- 913 N Sierra View St
- 824 Kevin Way
- 1119 N Las Posas Ct Unit A
- 1216 Denise Ave
- 1000 W Las Flores Ave
- 632 W Felspar Ave
- 717 Kevin Ct
- 1313 Autumn Way
- 807 Sherri St
- 644 Kevin Ct
- 612 Sylvia Ave
- 424 N Nevada St
- 817 Capehart Ct Unit A
- 817 Capehart Ct
- 825 Capehart Ct
- 809 Capehart Ct
- 812 Beach Ct
- 801 Capehart Ct
- 816 Capehart Ct
- 824 Capehart Ct
- 808 Capehart Ct
- 800 Capehart Ct
- 941 W Tamarisk Ave
- 1001 W Tamarisk Ave
- 1001 W Tamarisk Ave Unit B
- 937 W Tamarisk Ave Unit B
- 807 Beach Ct
- 1005 W Tamarisk Ave
- 933 W Tamarisk Ave
- 1033 Ocean Ave
- 1009 W Tamarisk Ave Unit B
- 1042 Ocean Ave