Estimated Value: $984,000 - $1,234,665
3
Beds
1
Bath
1,156
Sq Ft
$942/Sq Ft
Est. Value
About This Home
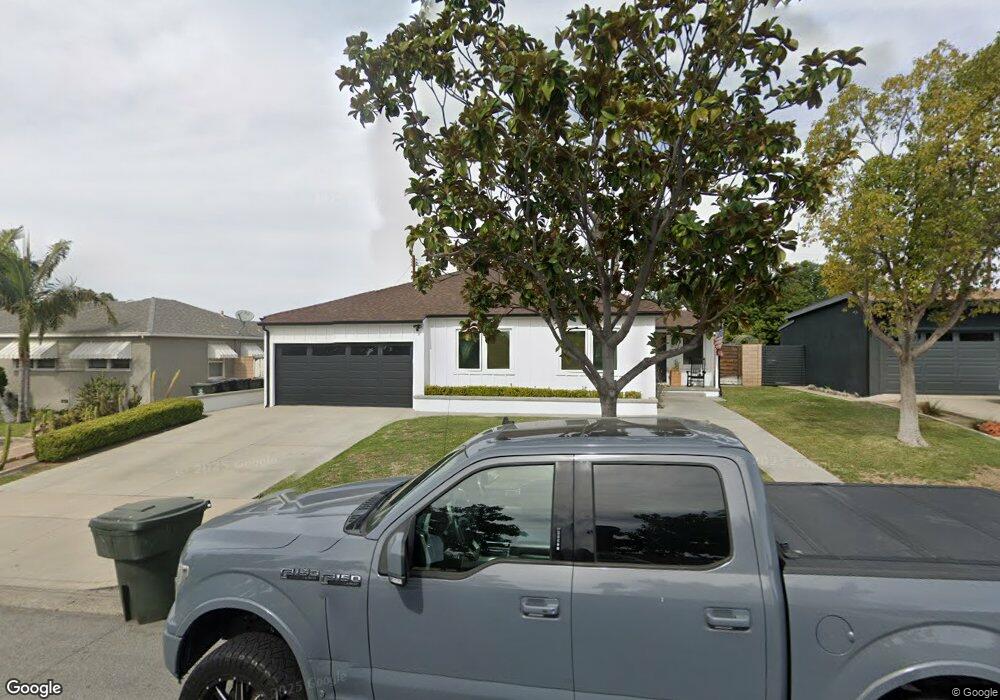
This home is located at 817 E Alder St, Brea, CA 92821 and is currently estimated at $1,088,916, approximately $941 per square foot. 817 E Alder St is a home located in Orange County with nearby schools including Arovista Elementary School, Brea Junior High School, and Brea-Olinda High School.
Ownership History
Date
Name
Owned For
Owner Type
Purchase Details
Closed on
Jun 14, 2004
Sold by
Auld Jeff and Prince Auld Amy
Bought by
Lowe Taylor and Lowe Sarah
Current Estimated Value
Home Financials for this Owner
Home Financials are based on the most recent Mortgage that was taken out on this home.
Original Mortgage
$364,900
Outstanding Balance
$171,086
Interest Rate
5.5%
Mortgage Type
Purchase Money Mortgage
Estimated Equity
$917,830
Purchase Details
Closed on
Aug 1, 2000
Sold by
Dennis Seitz and Dennis Glenda D
Bought by
Auld Jeff and Prince Auld Amy
Home Financials for this Owner
Home Financials are based on the most recent Mortgage that was taken out on this home.
Original Mortgage
$193,600
Interest Rate
9.87%
Purchase Details
Closed on
Apr 8, 1998
Sold by
Neal Glenda D and Neal Glenda D
Bought by
Seitz Dennis and Seitz Glenda D
Home Financials for this Owner
Home Financials are based on the most recent Mortgage that was taken out on this home.
Original Mortgage
$34,000
Interest Rate
7.07%
Create a Home Valuation Report for This Property
The Home Valuation Report is an in-depth analysis detailing your home's value as well as a comparison with similar homes in the area
Home Values in the Area
Average Home Value in this Area
Purchase History
| Date | Buyer | Sale Price | Title Company |
|---|---|---|---|
| Lowe Taylor | $470,000 | Southland Title | |
| Auld Jeff | $242,000 | Southland Title Corporation | |
| Seitz Dennis | -- | First American Title Ins Co |
Source: Public Records
Mortgage History
| Date | Status | Borrower | Loan Amount |
|---|---|---|---|
| Open | Lowe Taylor | $364,900 | |
| Previous Owner | Auld Jeff | $193,600 | |
| Previous Owner | Seitz Dennis | $34,000 | |
| Closed | Auld Jeff | $48,400 |
Source: Public Records
Tax History
| Year | Tax Paid | Tax Assessment Tax Assessment Total Assessment is a certain percentage of the fair market value that is determined by local assessors to be the total taxable value of land and additions on the property. | Land | Improvement |
|---|---|---|---|---|
| 2025 | $9,202 | $784,919 | $576,481 | $208,438 |
| 2024 | $8,749 | $769,529 | $565,178 | $204,351 |
| 2023 | $8,508 | $754,441 | $554,096 | $200,345 |
| 2022 | $8,429 | $739,649 | $543,232 | $196,417 |
| 2021 | $8,270 | $725,147 | $532,581 | $192,566 |
| 2020 | $8,215 | $717,712 | $527,120 | $190,592 |
| 2019 | $7,990 | $703,640 | $516,785 | $186,855 |
| 2018 | $7,401 | $647,307 | $506,652 | $140,655 |
| 2017 | $7,011 | $612,000 | $496,717 | $115,283 |
| 2016 | $6,541 | $570,000 | $461,767 | $108,233 |
| 2015 | $5,767 | $499,514 | $416,490 | $83,024 |
| 2014 | $5,340 | $466,000 | $408,332 | $57,668 |
Source: Public Records
Map
Nearby Homes
- 633 Laurel Ave
- 425 Cherry St
- 677 Magnolia Ave
- 522 S Brea Blvd
- 3059 Heather Dr
- 114 Juniper St
- 334 S Walnut Ave
- 404 Sievers Ave
- 1432 Vista Grande Unit 136
- 1428 Vista Grande Unit 134
- 127 S Redwood Ave
- 2708 Via Colina
- 2700 Via Colina Unit 7
- 2714 #12 Via Colina
- 145 S Poplar Ave Unit 20
- 2700 Via Portola Unit 45
- 3000 Associated Rd Unit 60
- 2700 Brea Blvd Unit 13
- 3054 Associated Rd Unit 20
- 2775 Pine Creek Cir Unit 116
- 821 E Alder St
- 813 E Alder St
- 634 Laurel Ave
- 825 E Alder St
- 629 S Poplar Ave
- 818 E Alder St
- 814 E Alder St
- 822 E Alder St
- 626 Laurel Ave
- 625 S Poplar Ave
- 810 E Alder St
- 826 E Alder St
- 637 Laurel Ave
- 643 Laurel Ave
- 806 E Alder St
- 622 Laurel Ave
- 621 S Poplar Ave
- 830 E Alder St
- 715 E Alder St
- 629 Laurel Ave
Your Personal Tour Guide
Ask me questions while you tour the home.