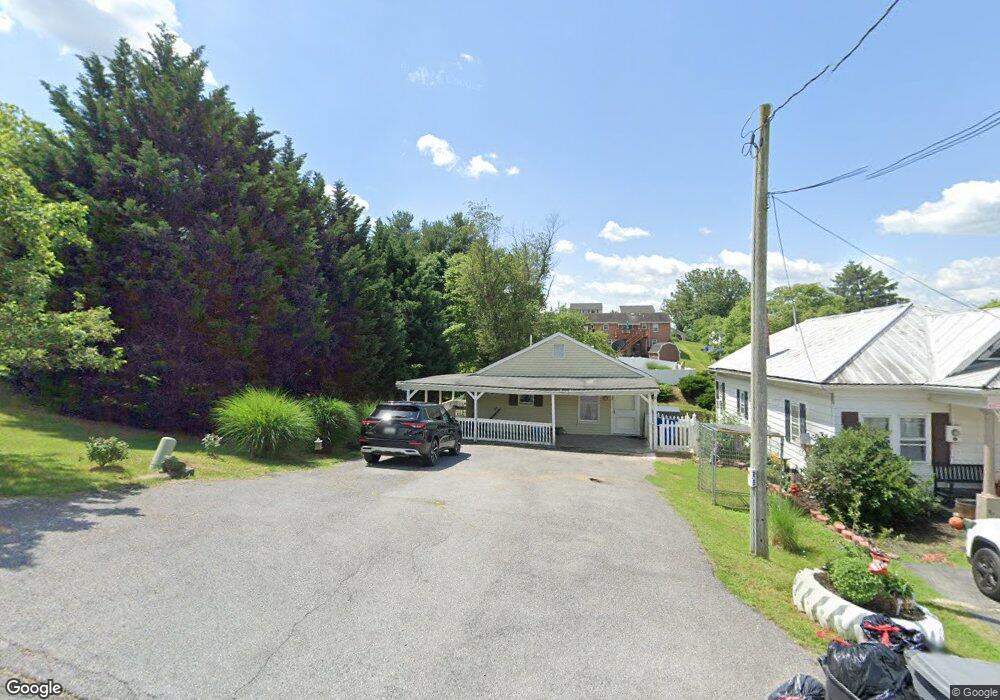
817 E E St Brunswick, MD 21716
Estimated Value: $210,000 - $314,000
Studio
1
Bath
864
Sq Ft
$290/Sq Ft
Est. Value
About This Home
This home is located at 817 E E St, Brunswick, MD 21716 and is currently estimated at $250,844, approximately $290 per square foot. 817 E E St is a home located in Frederick County with nearby schools including Brunswick Elementary School, Brunswick Middle School, and Brunswick High School.
Ownership History
Date
Name
Owned For
Owner Type
Purchase Details
Closed on
Jan 5, 2000
Sold by
Secretary Of Veterans Affairs
Bought by
Moore Shawna Renee
Current Estimated Value
Purchase Details
Closed on
Jun 30, 1999
Sold by
Viellenave Randall J and Viellenave Alexis K
Bought by
Secretary Of Veterans Affairs
Purchase Details
Closed on
Jun 3, 1996
Sold by
Hurd M Ann
Bought by
Viellenave Randall J and Viellenave Alexis K
Create a Home Valuation Report for This Property
The Home Valuation Report is an in-depth analysis detailing your home's value as well as a comparison with similar homes in the area
Home Values in the Area
Average Home Value in this Area
Purchase History
| Date | Buyer | Sale Price | Title Company |
|---|---|---|---|
| Moore Shawna Renee | $77,000 | -- | |
| Secretary Of Veterans Affairs | $62,410 | -- | |
| Viellenave Randall J | $88,000 | -- |
Source: Public Records
Mortgage History
| Date | Status | Borrower | Loan Amount |
|---|---|---|---|
| Closed | Viellenave Randall J | -- |
Source: Public Records
Tax History
| Year | Tax Paid | Tax Assessment Tax Assessment Total Assessment is a certain percentage of the fair market value that is determined by local assessors to be the total taxable value of land and additions on the property. | Land | Improvement |
|---|---|---|---|---|
| 2025 | $3,089 | $196,667 | -- | -- |
| 2024 | $3,089 | $186,100 | $85,200 | $100,900 |
| 2023 | $2,762 | $171,067 | $0 | $0 |
| 2022 | $2,527 | $156,033 | $0 | $0 |
| 2021 | $2,130 | $141,000 | $60,000 | $81,000 |
| 2020 | $2,130 | $130,600 | $0 | $0 |
| 2019 | $1,967 | $120,200 | $0 | $0 |
| 2018 | $1,836 | $109,800 | $43,100 | $66,700 |
| 2017 | $1,794 | $109,800 | $0 | $0 |
| 2016 | $2,007 | $105,800 | $0 | $0 |
| 2015 | $2,007 | $103,800 | $0 | $0 |
| 2014 | $2,007 | $103,800 | $0 | $0 |
Source: Public Records
Map
Nearby Homes
- 805 E B St
- 9 9th Ave
- 213 Wintergreen Ln
- 926 E A St
- 37 E C St
- 23 E F St
- 7 Afton Ct
- 0 E D St Unit MDFR2057714
- 519 N Maple Ave
- 8 S Maple Ave
- 7 W B St
- 11 W I St
- 21 W Orndorff Dr
- 15 N Maryland Ave
- 12 Evan Ct
- 8 N Virginia Ave
- 1602C New York Ave
- 126 Fiona Way
- TBB Shenandoah View Pkwy Unit ORCHID
- TBB Shenandoah View Pkwy Unit DAHLIA
Your Personal Tour Guide
Ask me questions while you tour the home.