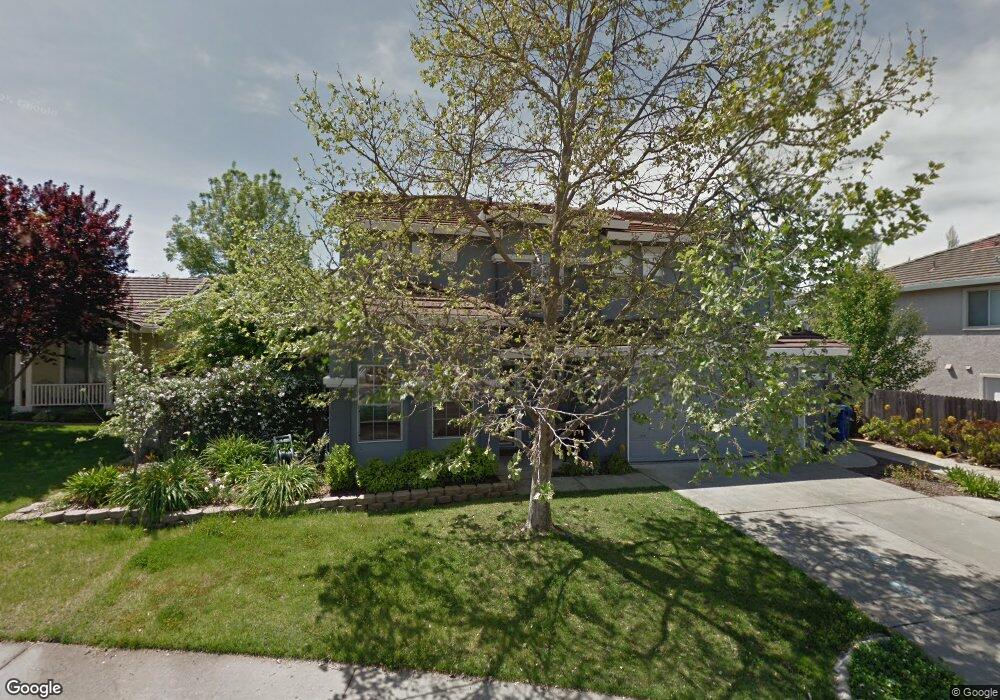
817 Fratis St Folsom, CA 95630
Prairie Oaks NeighborhoodEstimated Value: $484,000 - $789,000
4
Beds
3
Baths
2,180
Sq Ft
$313/Sq Ft
Est. Value
About This Home
This home is located at 817 Fratis St, Folsom, CA 95630 and is currently estimated at $681,901, approximately $312 per square foot. 817 Fratis St is a home located in Sacramento County with nearby schools including Sandra J. Gallardo Elementary School, Sutter Middle School, and Folsom High School.
Ownership History
Date
Name
Owned For
Owner Type
Purchase Details
Closed on
Jul 21, 2005
Sold by
Gladding John and Kuykendall Annie
Bought by
Gladding John A and Gladding Annie E
Current Estimated Value
Purchase Details
Closed on
Aug 25, 1999
Sold by
Kaufman & Broad Of Northern Ca Inc
Bought by
Gladding John and Kuykendall Annie
Home Financials for this Owner
Home Financials are based on the most recent Mortgage that was taken out on this home.
Original Mortgage
$169,650
Interest Rate
7.56%
Create a Home Valuation Report for This Property
The Home Valuation Report is an in-depth analysis detailing your home's value as well as a comparison with similar homes in the area
Home Values in the Area
Average Home Value in this Area
Purchase History
| Date | Buyer | Sale Price | Title Company |
|---|---|---|---|
| Gladding John A | -- | -- | |
| Gladding John | $214,000 | First American Title Ins Co |
Source: Public Records
Mortgage History
| Date | Status | Borrower | Loan Amount |
|---|---|---|---|
| Previous Owner | Gladding John | $169,650 |
Source: Public Records
Tax History
| Year | Tax Paid | Tax Assessment Tax Assessment Total Assessment is a certain percentage of the fair market value that is determined by local assessors to be the total taxable value of land and additions on the property. | Land | Improvement |
|---|---|---|---|---|
| 2025 | $4,423 | $369,047 | $58,388 | $310,659 |
| 2024 | $4,423 | $361,812 | $57,244 | $304,568 |
| 2023 | $4,343 | $354,719 | $56,122 | $298,597 |
| 2022 | $4,267 | $347,765 | $55,022 | $292,743 |
| 2021 | $4,216 | $340,947 | $53,944 | $287,003 |
| 2020 | $3,855 | $337,452 | $53,391 | $284,061 |
| 2019 | $3,793 | $330,837 | $52,345 | $278,492 |
| 2018 | $3,703 | $324,351 | $51,319 | $273,032 |
| 2017 | $4,883 | $317,992 | $50,313 | $267,679 |
| 2016 | $5,039 | $311,758 | $49,327 | $262,431 |
| 2015 | $4,869 | $307,077 | $48,587 | $258,490 |
| 2014 | $4,676 | $301,063 | $47,636 | $253,427 |
Source: Public Records
Map
Nearby Homes
- 157 Sutcliffe Cir
- 275 Barnhill Dr
- 894 Blossom Rock Ln
- 301 Blossom Rock Ln Unit 53
- 145 Hopfield Dr
- 631 Rogers Cir
- 122 Kennar Way
- 112 Demurrage Way
- 120 Conductor Way
- 860 Rathbone Cir
- 102 Black Gold Ln
- 187 John Henry Cir
- 1212 Vessona Cir Unit 1212
- 0 Figueroa St Unit 225034113
- 113 Ballast Way
- 107 Fantages Way
- 682 Diamond Glen Cir
- 885 Halidon Way Unit 1428
- 885 Halidon Way Unit 314
- 656 Silo St