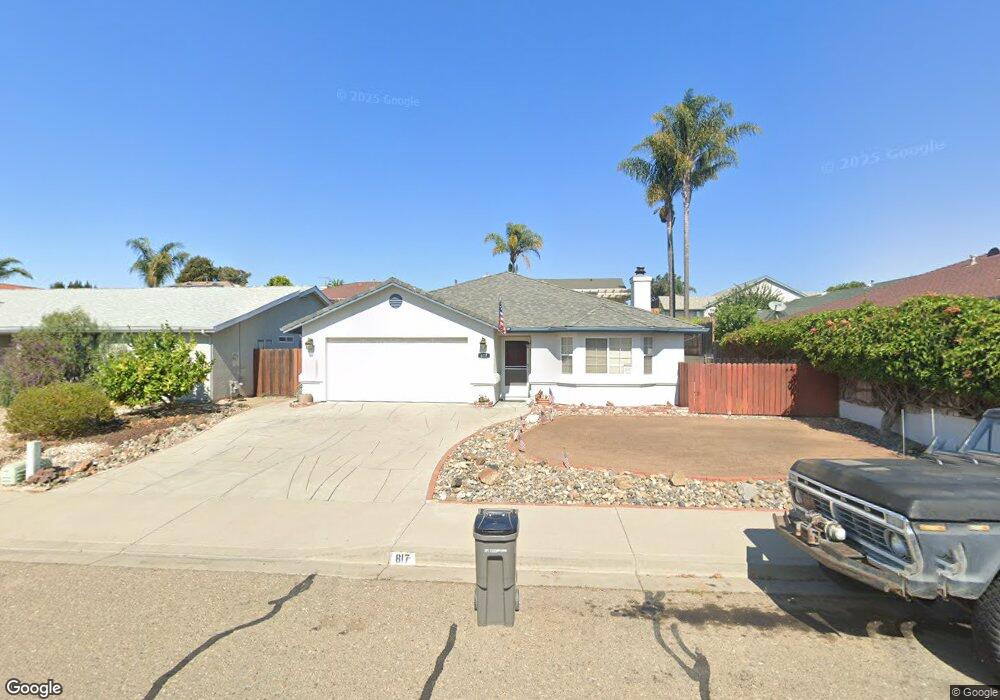
817 Jessica Place Nipomo, CA 93444
Estimated Value: $668,194 - $715,000
3
Beds
2
Baths
1,457
Sq Ft
$477/Sq Ft
Est. Value
About This Home
This home is located at 817 Jessica Place, Nipomo, CA 93444 and is currently estimated at $694,549, approximately $476 per square foot. 817 Jessica Place is a home located in San Luis Obispo County with nearby schools including Dorothea Lange Elementary School, Mesa Middle School, and Nipomo High School.
Ownership History
Date
Name
Owned For
Owner Type
Purchase Details
Closed on
Jul 20, 2021
Sold by
Carroll Greggory L and Dauster Carroll Tina
Bought by
Hampton Richard E and Hampton Carol J
Current Estimated Value
Purchase Details
Closed on
Jun 21, 2013
Sold by
Carroll Greggory L and Dauster Carroll Tina Marie
Bought by
Carroll Greggory L and Dauster Carroll Tina Marie
Purchase Details
Closed on
Feb 4, 1996
Sold by
Sorenson Todd A
Bought by
Carroll Gregory L and Dauster Carroll Tina M
Purchase Details
Closed on
Feb 1, 1995
Sold by
Andys L P
Bought by
Sorenson Todd A
Home Financials for this Owner
Home Financials are based on the most recent Mortgage that was taken out on this home.
Original Mortgage
$38,500
Interest Rate
8.81%
Mortgage Type
Purchase Money Mortgage
Create a Home Valuation Report for This Property
The Home Valuation Report is an in-depth analysis detailing your home's value as well as a comparison with similar homes in the area
Home Values in the Area
Average Home Value in this Area
Purchase History
| Date | Buyer | Sale Price | Title Company |
|---|---|---|---|
| Hampton Richard E | $510,000 | First American Title Company | |
| Carroll Greggory L | -- | None Available | |
| Carroll Gregory L | $146,000 | Chicago Title Co | |
| Sorenson Todd A | $110,000 | First American Title |
Source: Public Records
Mortgage History
| Date | Status | Borrower | Loan Amount |
|---|---|---|---|
| Previous Owner | Sorenson Todd A | $38,500 |
Source: Public Records
Tax History Compared to Growth
Tax History
| Year | Tax Paid | Tax Assessment Tax Assessment Total Assessment is a certain percentage of the fair market value that is determined by local assessors to be the total taxable value of land and additions on the property. | Land | Improvement |
|---|---|---|---|---|
| 2025 | $5,585 | $541,215 | $217,547 | $323,668 |
| 2024 | $5,521 | $530,604 | $213,282 | $317,322 |
| 2023 | $5,521 | $520,200 | $209,100 | $311,100 |
| 2022 | $5,438 | $510,000 | $205,000 | $305,000 |
| 2021 | $2,400 | $227,108 | $92,068 | $135,040 |
| 2020 | $2,372 | $224,780 | $91,124 | $133,656 |
| 2019 | $2,356 | $220,374 | $89,338 | $131,036 |
| 2018 | $2,326 | $216,054 | $87,587 | $128,467 |
| 2017 | $2,282 | $211,819 | $85,870 | $125,949 |
| 2016 | $2,151 | $207,667 | $84,187 | $123,480 |
| 2015 | $2,120 | $204,549 | $82,923 | $121,626 |
| 2014 | $2,040 | $200,543 | $81,299 | $119,244 |
Source: Public Records
Map
Nearby Homes
- 522 Higos Way
- 840 Story St
- 725 Monarch Ln
- 945 Jeanette Ln
- 483 Violet Ave
- 457 Polaris Dr
- 426 Polaris Dr
- 1127 Starlite Dr
- 393 Uranus Ct
- 626 Juno Ct
- 232 Scarlett Cir
- 468 Neptune Dr
- 1180 Starlite Dr
- 261 Hazel Ln
- 368 Avenida de Amigos
- 450 Avenida de Socios Unit 12
- Mesa Plan at Hill Street Terraces - Hill Street Series
- Pacific Plan at Hill Street Terraces - Hill Street Series
- Monarch Plan at Hill Street Terraces - Hill Street Series
- Rancho Plan at Hill Street Terraces - Hill Street Series
- 823 Jessica Place
- 550 Amelia Way
- 540 Amelia Way
- 818 Rosana Place
- 824 Rosana Place
- 829 Jessica Place
- 530 Amelia Way
- 818 Jessica Place
- 830 Rosana Place
- 814 Jessica Place
- 812 Rosana Place Unit LOT
- 824 Jessica Place
- 835 Jessica Place
- 812 Jessica Place
- 836 Rosana Place
- 830 Jessica Place
- 555 Amelia Way
- 545 Amelia Way
- 810 Jessica Place