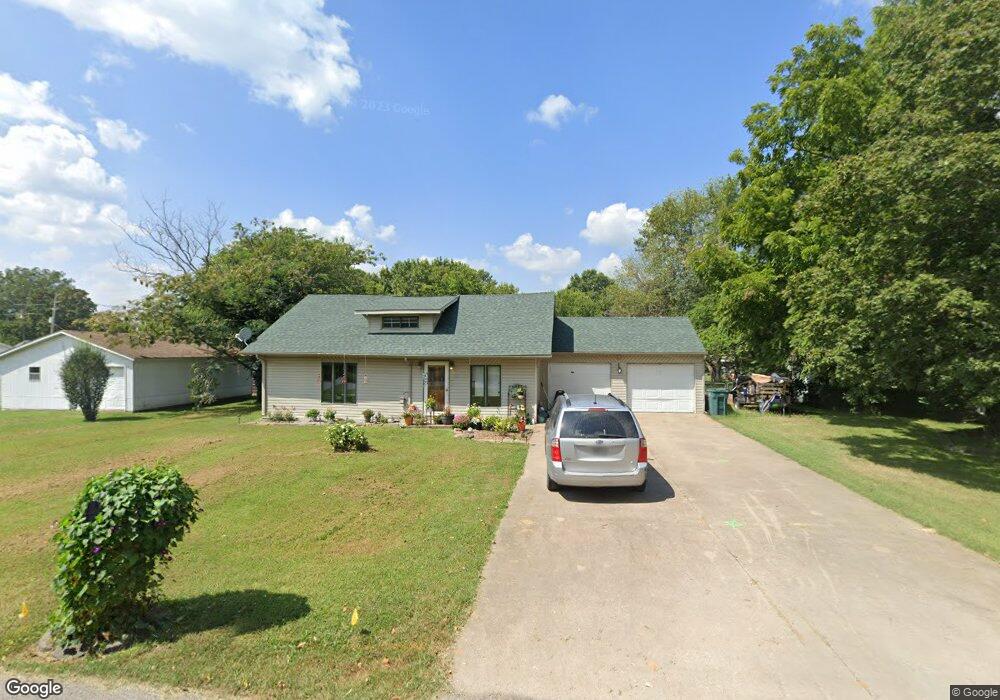
817 Morgan Ave Aurora, MO 65605
Estimated Value: $115,000 - $149,000
3
Beds
2
Baths
1,050
Sq Ft
$125/Sq Ft
Est. Value
About This Home
This home is located at 817 Morgan Ave, Aurora, MO 65605 and is currently estimated at $130,868, approximately $124 per square foot. 817 Morgan Ave is a home located in Lawrence County with nearby schools including Pate Early Childhood Center, Robinson Intermediate School, and Robinson Elementary School.
Ownership History
Date
Name
Owned For
Owner Type
Purchase Details
Closed on
Aug 24, 2011
Sold by
Cibert Dan and Cibert Alice
Bought by
Mchenry Annette M and Lopez Elena
Current Estimated Value
Home Financials for this Owner
Home Financials are based on the most recent Mortgage that was taken out on this home.
Original Mortgage
$61,600
Outstanding Balance
$42,671
Interest Rate
4.58%
Estimated Equity
$88,197
Purchase Details
Closed on
Sep 21, 2009
Sold by
Deutsche Bank National Trust Company
Bought by
Cibert Dan
Purchase Details
Closed on
Jun 18, 2009
Sold by
Erickson Troy and Erickson Diana K
Bought by
Deutsche Bank National Trust Co
Purchase Details
Closed on
Mar 9, 2006
Sold by
Friggle Brandt and Friggle Tori
Bought by
Erickson Troy and Erickson Diana K
Home Financials for this Owner
Home Financials are based on the most recent Mortgage that was taken out on this home.
Original Mortgage
$78,750
Interest Rate
9.95%
Mortgage Type
Adjustable Rate Mortgage/ARM
Create a Home Valuation Report for This Property
The Home Valuation Report is an in-depth analysis detailing your home's value as well as a comparison with similar homes in the area
Home Values in the Area
Average Home Value in this Area
Purchase History
| Date | Buyer | Sale Price | Title Company |
|---|---|---|---|
| Mchenry Annette M | -- | -- | |
| Mchenry Annette M | $32,000 | Lincoln Land Title | |
| Cibert Dan | -- | -- | |
| Cibert Dan | $32,000 | Servicelink | |
| Deutsche Bank National Trust Co | $65,450 | None Available | |
| Erickson Troy | -- | Great American Title |
Source: Public Records
Mortgage History
| Date | Status | Borrower | Loan Amount |
|---|---|---|---|
| Open | Mchenry Annette M | $61,600 | |
| Closed | Mchenry Annette M | $61,600 | |
| Previous Owner | Erickson Troy | $78,750 |
Source: Public Records
Tax History
| Year | Tax Paid | Tax Assessment Tax Assessment Total Assessment is a certain percentage of the fair market value that is determined by local assessors to be the total taxable value of land and additions on the property. | Land | Improvement |
|---|---|---|---|---|
| 2025 | $541 | $10,810 | $1,820 | $8,990 |
| 2024 | $500 | $9,910 | $1,820 | $8,090 |
| 2023 | $497 | $9,910 | $1,820 | $8,090 |
| 2022 | $468 | $9,330 | $1,820 | $7,510 |
| 2021 | $526 | $10,480 | $1,820 | $8,660 |
| 2020 | $497 | $9,800 | $1,140 | $8,660 |
| 2019 | $488 | $9,800 | $1,140 | $8,660 |
| 2018 | $488 | $9,800 | $1,140 | $8,660 |
| 2017 | $485 | $9,800 | $1,140 | $8,660 |
| 2016 | -- | $8,970 | $1,140 | $7,830 |
| 2015 | -- | $8,970 | $1,140 | $7,830 |
| 2014 | -- | $8,970 | $1,140 | $7,830 |
Source: Public Records
Map
Nearby Homes
- 115 W Lee St
- 722 Wilson Ave
- 330 W Summit St
- 503 Mcnatt Ave
- 405 W Summit St
- 407 W Summit St Unit A & B
- 123 Cofield St
- 225 Morgan Ave
- 15 E Cofield St
- 111 W Cofield St
- 238 E Delta St
- 304 E Cofield St
- 112 N Madison Ave
- 000 Crescent St
- 141 W Pleasant St
- 311 W Pleasant St
- 303 N Hudson Ave
- 216 S Elliott Ave
- 220 S Park Ave
- 421 W College St
- 207 W High St
- 831 Morgan Ave
- 831 Morgan Ave Unit 1315014
- 209 W High St
- 804 Morgan Ave
- 211 W High St
- 220 W Hawthorne St
- 138 W Hawthorne St
- 200 W High St
- 129 W High St
- 135 W Hawthorne St
- 217 W High St
- 903 Morgan Ave
- 903 Morgan Ave Unit 1402767
- 725 Morgan Ave
- 134 W Hawthorne St
- 903 Morgan Ave
- 127 W High St
- 219 W High St
- 212 W High St