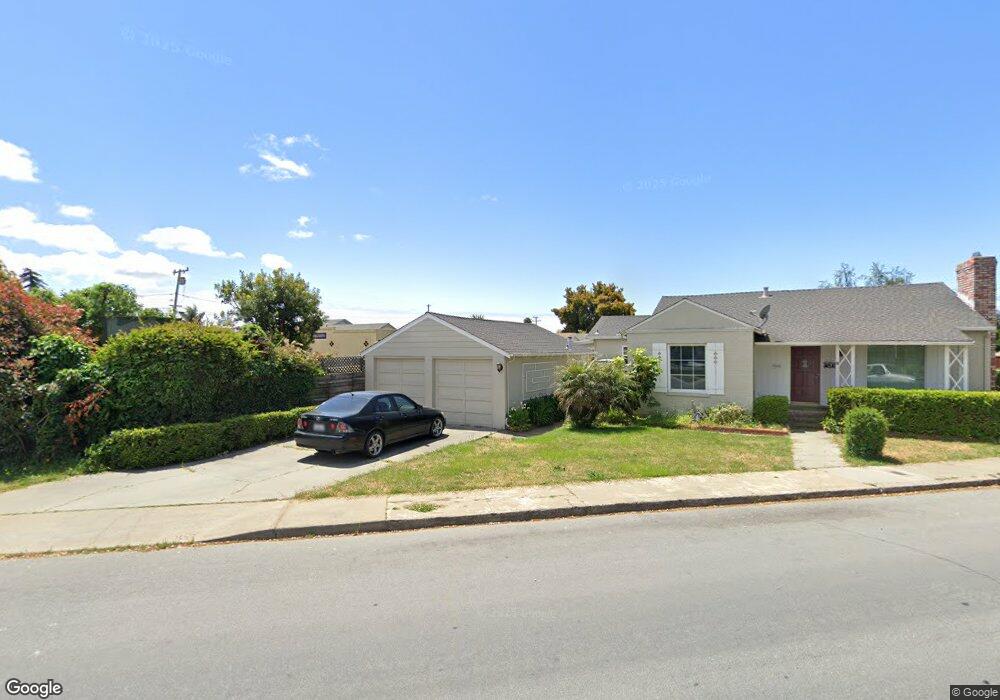
817 Tuttle Ave Watsonville, CA 95076
Estimated Value: $662,000 - $926,000
2
Beds
2
Baths
1,319
Sq Ft
$565/Sq Ft
Est. Value
About This Home
This home is located at 817 Tuttle Ave, Watsonville, CA 95076 and is currently estimated at $745,158, approximately $564 per square foot. 817 Tuttle Ave is a home located in Santa Cruz County with nearby schools including Mintie White Elementary School, E.A. Hall Middle School, and Watsonville High School.
Ownership History
Date
Name
Owned For
Owner Type
Purchase Details
Closed on
Feb 27, 2009
Sold by
Chagolla Carlos
Bought by
Leach Stephanie and Leach James L
Current Estimated Value
Home Financials for this Owner
Home Financials are based on the most recent Mortgage that was taken out on this home.
Original Mortgage
$261,182
Outstanding Balance
$165,636
Interest Rate
5.08%
Mortgage Type
FHA
Estimated Equity
$579,522
Purchase Details
Closed on
Nov 12, 2007
Sold by
Chagolla Rocquel
Bought by
Chagolla Carlos
Purchase Details
Closed on
May 30, 2001
Sold by
Fontana Robert L and The Fontana Family Trust
Bought by
Chagolla Carlos and Chagolla Rocquel
Home Financials for this Owner
Home Financials are based on the most recent Mortgage that was taken out on this home.
Original Mortgage
$275,000
Interest Rate
7.14%
Purchase Details
Closed on
Dec 15, 1995
Sold by
Fontana Estelle B
Bought by
Fontana Estelle B
Create a Home Valuation Report for This Property
The Home Valuation Report is an in-depth analysis detailing your home's value as well as a comparison with similar homes in the area
Home Values in the Area
Average Home Value in this Area
Purchase History
| Date | Buyer | Sale Price | Title Company |
|---|---|---|---|
| Leach Stephanie | $266,000 | First American Title Company | |
| Chagolla Carlos | -- | None Available | |
| Chagolla Carlos | $388,000 | Santa Cruz Title Company | |
| Fontana Estelle B | -- | -- | |
| Fontana Estelle B | -- | -- |
Source: Public Records
Mortgage History
| Date | Status | Borrower | Loan Amount |
|---|---|---|---|
| Open | Leach Stephanie | $261,182 | |
| Previous Owner | Chagolla Carlos | $275,000 |
Source: Public Records
Tax History
| Year | Tax Paid | Tax Assessment Tax Assessment Total Assessment is a certain percentage of the fair market value that is determined by local assessors to be the total taxable value of land and additions on the property. | Land | Improvement |
|---|---|---|---|---|
| 2025 | $3,934 | $342,545 | $205,527 | $137,018 |
| 2023 | $3,872 | $329,245 | $197,547 | $131,698 |
| 2022 | $3,819 | $322,788 | $193,673 | $129,115 |
| 2021 | $3,819 | $316,460 | $189,876 | $126,584 |
| 2020 | $3,765 | $313,215 | $187,929 | $125,286 |
| 2019 | $3,698 | $307,073 | $184,244 | $122,829 |
| 2018 | $3,606 | $301,052 | $180,631 | $120,421 |
| 2017 | $3,575 | $295,150 | $177,090 | $118,060 |
| 2016 | $3,482 | $289,363 | $173,618 | $115,745 |
| 2015 | $3,470 | $285,016 | $171,010 | $114,006 |
| 2014 | $3,396 | $279,433 | $167,660 | $111,773 |
Source: Public Records
Map
Nearby Homes
- 618 Washington St
- 625 Oregon St
- 614 Washington St
- 617 Oregon St
- 629 Oregon St
- 816 Tuttle Ave
- 613 Oregon St
- 610 Washington St
- 704 Washington St
- 633 Oregon St
- 615 Washington St
- 611 Oregon St
- 774 Tuttle Ave
- 709 Oregon St
- 708 Washington St
- 308 Hill Ave
- 312 Hill Ave
- 705 Washington St
- 304 Hill Ave
- 915 Tuttle Ave
Your Personal Tour Guide
Ask me questions while you tour the home.