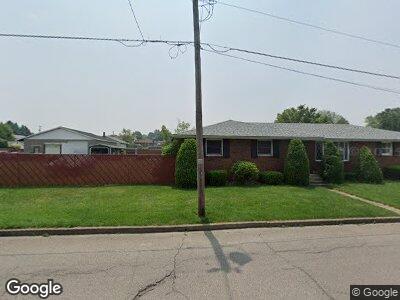
817 W 17th St Hazleton, PA 18201
Estimated Value: $221,298 - $304,000
--
Bed
--
Bath
2,226
Sq Ft
$111/Sq Ft
Est. Value
About This Home
This home is located at 817 W 17th St, Hazleton, PA 18201 and is currently estimated at $247,825, approximately $111 per square foot. 817 W 17th St is a home located in Luzerne County with nearby schools including Hazleton Area High School, Immanuel Christian School, and Bishop Hafey Junior/Senior High School.
Ownership History
Date
Name
Owned For
Owner Type
Purchase Details
Closed on
Nov 1, 2019
Sold by
Stock Jeffrey J
Bought by
Stock Jared Jeffrey and Stock Briana Lee
Current Estimated Value
Home Financials for this Owner
Home Financials are based on the most recent Mortgage that was taken out on this home.
Original Mortgage
$120,000
Outstanding Balance
$106,899
Interest Rate
3.7%
Mortgage Type
New Conventional
Estimated Equity
$137,883
Purchase Details
Closed on
Dec 12, 1997
Bought by
Stock Jeffrey J
Create a Home Valuation Report for This Property
The Home Valuation Report is an in-depth analysis detailing your home's value as well as a comparison with similar homes in the area
Home Values in the Area
Average Home Value in this Area
Purchase History
| Date | Buyer | Sale Price | Title Company |
|---|---|---|---|
| Stock Jared Jeffrey | $150,000 | Covenant Abstract | |
| Stock Jeffrey J | -- | -- |
Source: Public Records
Mortgage History
| Date | Status | Borrower | Loan Amount |
|---|---|---|---|
| Open | Stock Jared Jeffrey | $120,000 | |
| Previous Owner | Stock Jeffery J | $143,200 | |
| Previous Owner | Stock Jeffrey J | $35,800 |
Source: Public Records
Tax History Compared to Growth
Tax History
| Year | Tax Paid | Tax Assessment Tax Assessment Total Assessment is a certain percentage of the fair market value that is determined by local assessors to be the total taxable value of land and additions on the property. | Land | Improvement |
|---|---|---|---|---|
| 2025 | $3,978 | $138,500 | $25,600 | $112,900 |
| 2024 | $3,727 | $138,500 | $25,600 | $112,900 |
| 2023 | $3,485 | $138,500 | $25,600 | $112,900 |
| 2022 | $3,459 | $138,500 | $25,600 | $112,900 |
| 2021 | $3,379 | $138,500 | $25,600 | $112,900 |
| 2020 | $3,019 | $138,500 | $25,600 | $112,900 |
| 2019 | $3,115 | $138,500 | $25,600 | $112,900 |
| 2018 | $3,009 | $138,500 | $25,600 | $112,900 |
| 2017 | $2,774 | $138,500 | $25,600 | $112,900 |
| 2016 | $1,587 | $138,500 | $25,600 | $112,900 |
| 2015 | $1,556 | $138,500 | $25,600 | $112,900 |
| 2014 | $1,556 | $138,500 | $25,600 | $112,900 |
Source: Public Records
Map
Nearby Homes