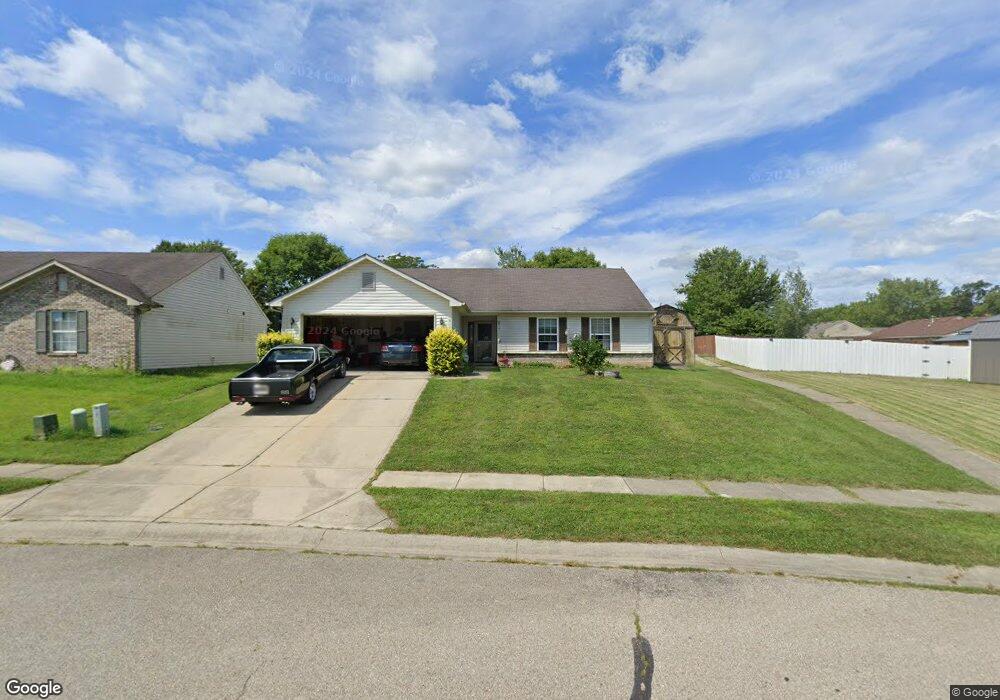
8170 N Burbrink Dr Columbus, IN 47201
Estimated Value: $235,123 - $244,000
3
Beds
2
Baths
1,376
Sq Ft
$174/Sq Ft
Est. Value
About This Home
This home is located at 8170 N Burbrink Dr, Columbus, IN 47201 and is currently estimated at $239,031, approximately $173 per square foot. 8170 N Burbrink Dr is a home located in Bartholomew County with nearby schools including Taylorsville Elementary School, Northside Middle School, and Columbus North High School.
Ownership History
Date
Name
Owned For
Owner Type
Purchase Details
Closed on
Sep 10, 2008
Sold by
Not Provided
Bought by
Lavender Michael W and Lavender Melinda L
Current Estimated Value
Purchase Details
Closed on
Sep 9, 2008
Sold by
Walton Deborah L and Watkins Bobby Joe
Bought by
Lavender Michael W and Lavender Melinda L
Purchase Details
Closed on
May 28, 2008
Sold by
Secretary Housing Urban Development
Bought by
Walton Deborah L and Watkins Bobby Joe
Purchase Details
Closed on
Nov 15, 2007
Sold by
Sheriff Of Bartholomew County and Scroggins Gary L
Bought by
Citimortgage Inc
Purchase Details
Closed on
Dec 30, 1999
Sold by
Crossmann Comm Prtnshp
Bought by
Scroggins Gary L and Scroggins Sharon L
Create a Home Valuation Report for This Property
The Home Valuation Report is an in-depth analysis detailing your home's value as well as a comparison with similar homes in the area
Home Values in the Area
Average Home Value in this Area
Purchase History
| Date | Buyer | Sale Price | Title Company |
|---|---|---|---|
| Lavender Michael W | $115,000 | -- | |
| Lavender Michael W | $115,000 | Smart & Johnson Title Corp | |
| Not Provided | $115,000 | Smart & Johnson Title Corp | |
| Lavender Michael W | $115,000 | Smart & Johnson Title Corp | |
| Walton Deborah L | -- | None Available | |
| Citimortgage Inc | $127,199 | Attorney | |
| Scroggins Gary L | $118,765 | -- |
Source: Public Records
Mortgage History
| Date | Status | Borrower | Loan Amount |
|---|---|---|---|
| Closed | Citimortgage Inc | $0 |
Source: Public Records
Tax History Compared to Growth
Tax History
| Year | Tax Paid | Tax Assessment Tax Assessment Total Assessment is a certain percentage of the fair market value that is determined by local assessors to be the total taxable value of land and additions on the property. | Land | Improvement |
|---|---|---|---|---|
| 2024 | $1,176 | $171,900 | $31,600 | $140,300 |
| 2023 | $1,040 | $159,500 | $31,600 | $127,900 |
| 2022 | $1,092 | $158,200 | $31,600 | $126,600 |
| 2021 | $1,003 | $148,200 | $20,500 | $127,700 |
| 2020 | $692 | $115,800 | $20,500 | $95,300 |
| 2019 | $613 | $115,700 | $20,500 | $95,200 |
| 2018 | $561 | $110,000 | $20,500 | $89,500 |
| 2017 | $527 | $106,600 | $20,500 | $86,100 |
| 2016 | $537 | $107,700 | $20,500 | $87,200 |
| 2014 | $541 | $105,300 | $20,500 | $84,800 |
Source: Public Records
Map
Nearby Homes
- 8145 Sunset Ct
- 8437 N Sheffield Ct
- 1128 Franklin St
- 9117 Main St
- 1145 Dacia St
- 2929 W 650 N
- 1620 John St
- 9632 5th St
- 2034 Buckthorn Dr
- 2044 Buckthorn Dr
- 2094 Buckthorn Dr
- 5924 Woodland Parks Ct
- 7752 Parkland Dr
- 4986 Adkins St
- 7951 N 400 W
- 7265 N 400 W
- 4740 Blue Cedar Ct
- 4611 N 150 W
- 1045 Driftwood Ave
- 1959 St James Place
- 8146 N Burbrink Dr
- 8182 N Burbrink Dr
- 8124 N Burbrink Dr
- 8169 N Burbrink Dr
- 2203 Fiesbeck Dr
- 8101 N Harvest Ct
- 8147 N Burbrink Dr
- 2143 Fiesbeck Dr
- 8102 N Burbrink Dr
- 8163 N Harvest Ln
- 8141 N Harvest Ln
- 2233 Fiesbeck Dr
- 8129 N Harvest Ln
- 8103 N Burbrink Dr
- 2113 Fiesbeck Dr
- 8084 N Burbrink Dr
- 8122 Sunset Ct
- 8212 N Burbrink Dr
- 8146 Sunset Ct