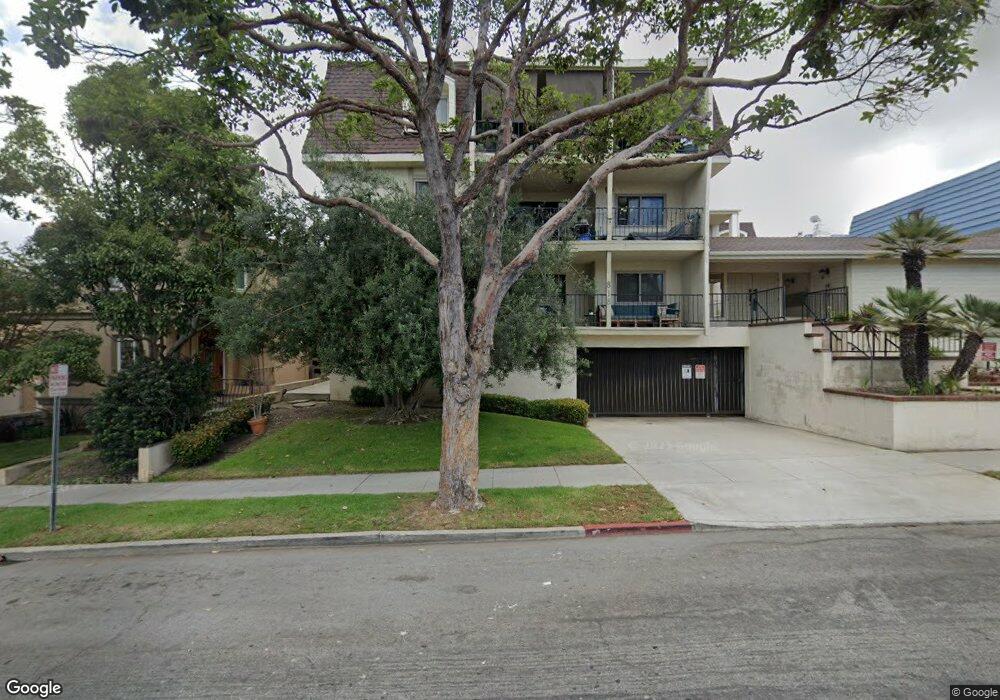
818 Main St Unit 301 El Segundo, CA 90245
Estimated Value: $779,000 - $904,000
2
Beds
2
Baths
1,406
Sq Ft
$601/Sq Ft
Est. Value
About This Home
This home is located at 818 Main St Unit 301, El Segundo, CA 90245 and is currently estimated at $845,376, approximately $601 per square foot. 818 Main St Unit 301 is a home located in Los Angeles County with nearby schools including Richmond Street Elementary School, El Segundo Middle School, and El Segundo High School.
Ownership History
Date
Name
Owned For
Owner Type
Purchase Details
Closed on
Oct 18, 2025
Sold by
Huerta Anastasia
Bought by
Huerta
Current Estimated Value
Purchase Details
Closed on
Jul 25, 2011
Sold by
Heyman Brett Sharon and The Sharon Heyman Brett Trust
Bought by
Huerta Christopher and Huerta Anastasia
Home Financials for this Owner
Home Financials are based on the most recent Mortgage that was taken out on this home.
Original Mortgage
$369,000
Interest Rate
4.53%
Mortgage Type
New Conventional
Purchase Details
Closed on
Nov 4, 2005
Sold by
Heyman Brett Sharon K
Bought by
Heyman Brett Sharon and Sharon Heyman Brett Trust
Home Financials for this Owner
Home Financials are based on the most recent Mortgage that was taken out on this home.
Original Mortgage
$400,000
Interest Rate
5.9%
Mortgage Type
Fannie Mae Freddie Mac
Purchase Details
Closed on
Nov 2, 2005
Sold by
Brett Kemer
Bought by
Heyman Brett Sharon
Home Financials for this Owner
Home Financials are based on the most recent Mortgage that was taken out on this home.
Original Mortgage
$400,000
Interest Rate
5.9%
Mortgage Type
Fannie Mae Freddie Mac
Purchase Details
Closed on
Aug 9, 2005
Sold by
Heyman Sharon
Bought by
Heyman Brett Sharon K and The Sharon K Heyman Brett Trust
Purchase Details
Closed on
Nov 4, 2003
Sold by
Brett Kemer M and Heyman Sharon
Bought by
Heyman Sharon
Home Financials for this Owner
Home Financials are based on the most recent Mortgage that was taken out on this home.
Original Mortgage
$322,700
Interest Rate
5.72%
Mortgage Type
Purchase Money Mortgage
Purchase Details
Closed on
Jan 13, 2003
Sold by
Stening Wayne J
Bought by
Heyman Sharon
Home Financials for this Owner
Home Financials are based on the most recent Mortgage that was taken out on this home.
Original Mortgage
$301,500
Interest Rate
5.76%
Purchase Details
Closed on
Aug 24, 1998
Sold by
Stening Wayne J and The Wayne J Stening Family Tru
Bought by
Stening Wayne J
Home Financials for this Owner
Home Financials are based on the most recent Mortgage that was taken out on this home.
Original Mortgage
$155,450
Interest Rate
6.92%
Purchase Details
Closed on
Nov 8, 1997
Sold by
Stening Wayne
Bought by
Stening Wayne J and Wayne J Stening Family Trust
Purchase Details
Closed on
Jan 8, 1997
Sold by
Trust Palmer Robert H And Ina J Trs Palm
Bought by
Stening Wayne
Home Financials for this Owner
Home Financials are based on the most recent Mortgage that was taken out on this home.
Original Mortgage
$129,350
Interest Rate
7.25%
Create a Home Valuation Report for This Property
The Home Valuation Report is an in-depth analysis detailing your home's value as well as a comparison with similar homes in the area
Home Values in the Area
Average Home Value in this Area
Purchase History
| Date | Buyer | Sale Price | Title Company |
|---|---|---|---|
| Huerta | -- | None Listed On Document | |
| Huerta Christopher | $419,000 | Ticor Title | |
| Heyman Brett Sharon | -- | None Available | |
| Heyman Brett Sharon | -- | Chicago Title Co | |
| Heyman Brett Sharon | -- | First American Title Company | |
| Heyman Brett Sharon K | -- | -- | |
| Heyman Sharon | -- | Chicago Title Co | |
| Heyman Sharon | $335,000 | First American Title Co | |
| Stening Wayne J | -- | Southland Title Corporation | |
| Stening Wayne J | -- | -- | |
| Stening Wayne | $172,500 | Investors Title Company |
Source: Public Records
Mortgage History
| Date | Status | Borrower | Loan Amount |
|---|---|---|---|
| Previous Owner | Huerta Christopher | $369,000 | |
| Previous Owner | Heyman Brett Sharon | $400,000 | |
| Previous Owner | Heyman Brett Sharon | $400,000 | |
| Previous Owner | Heyman Sharon | $322,700 | |
| Previous Owner | Heyman Sharon | $301,500 | |
| Previous Owner | Stening Wayne J | $155,450 | |
| Previous Owner | Stening Wayne | $129,350 |
Source: Public Records
Tax History
| Year | Tax Paid | Tax Assessment Tax Assessment Total Assessment is a certain percentage of the fair market value that is determined by local assessors to be the total taxable value of land and additions on the property. | Land | Improvement |
|---|---|---|---|---|
| 2025 | $5,873 | $526,273 | $287,505 | $238,768 |
| 2024 | $5,873 | $515,955 | $281,868 | $234,087 |
| 2023 | $5,721 | $505,840 | $276,342 | $229,498 |
| 2022 | $5,784 | $495,923 | $270,924 | $224,999 |
| 2021 | $5,699 | $486,200 | $265,612 | $220,588 |
| 2019 | $5,505 | $471,782 | $257,735 | $214,047 |
| 2018 | $5,172 | $462,532 | $252,682 | $209,850 |
| 2016 | $5,017 | $444,573 | $242,871 | $201,702 |
| 2015 | $4,955 | $437,896 | $239,223 | $198,673 |
| 2014 | $4,853 | $429,319 | $234,537 | $194,782 |
Source: Public Records
Map
Nearby Homes
- 745 Main St
- 121 E Walnut Ave
- 924 Main St
- 935 Main St Unit 303
- 329 E Maple Ave
- 212 E Imperial Ave Unit A
- 212 E Imperial Ave Unit E
- 219 W Acacia Ave
- 519 E Sycamore Ave
- 955 Virginia St
- 426 E Imperial Ave
- 529 E Walnut Ave
- 211 E Pine Ave
- 572 E Imperial Ave
- 724 Loma Vista St
- 412 Richmond St
- 529 Sierra Place
- 804 Hillcrest St
- 627 W Pine Ave
- 408 Loma Vista St
- 818 Main St Unit 303
- 818 Main St Unit 302
- 818 Main St Unit 203
- 818 Main St Unit 202
- 818 Main St Unit 201
- 818 Main St Unit 103
- 818 Main St Unit 102
- 818 Main St Unit 101
- 822 Main St
- 822 Main St Unit 3
- 822 Main St Unit 2
- 822 Main St Unit 1
- 821 Pepper St
- 817 Pepper St
- 826 Main St
- 826 Main St Unit 7
- 826 Main St Unit 6
- 826 Main St Unit 4
- 826 Main St Unit 3
- 826 Main St Unit 2
Your Personal Tour Guide
Ask me questions while you tour the home.