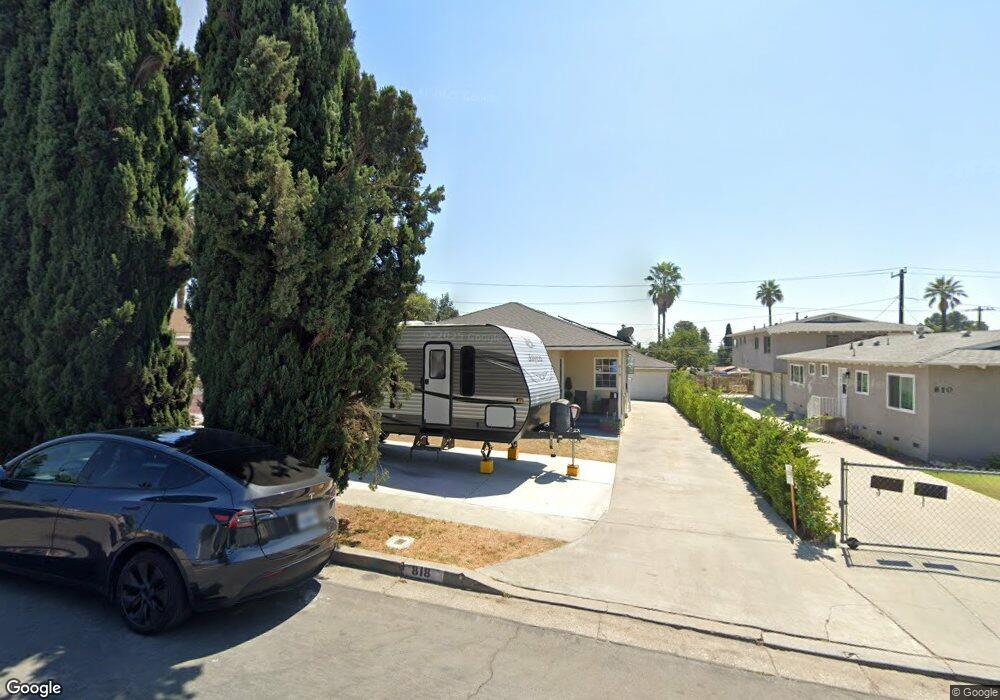
818 Morada Place Altadena, CA 91001
Estimated Value: $615,000 - $1,018,746
3
Beds
2
Baths
1,414
Sq Ft
$541/Sq Ft
Est. Value
About This Home
This home is located at 818 Morada Place, Altadena, CA 91001 and is currently estimated at $765,582, approximately $541 per square foot. 818 Morada Place is a home located in Los Angeles County with nearby schools including Altadena Arts Magnet Elementary, Charles W. Eliot Arts Magnet Academy, and John Muir High School.
Ownership History
Date
Name
Owned For
Owner Type
Purchase Details
Closed on
Jun 6, 2001
Sold by
Blaylock Michael D
Bought by
Blaylock Michael D and Jackson Kim A
Current Estimated Value
Home Financials for this Owner
Home Financials are based on the most recent Mortgage that was taken out on this home.
Original Mortgage
$233,750
Outstanding Balance
$89,040
Interest Rate
7.14%
Mortgage Type
Stand Alone First
Estimated Equity
$676,542
Purchase Details
Closed on
Aug 23, 1995
Sold by
Blaylock Michelle T
Bought by
Blaylock Michael D
Purchase Details
Closed on
Mar 29, 1995
Sold by
Emc Mtg Corp
Bought by
Blaylock Michael D
Home Financials for this Owner
Home Financials are based on the most recent Mortgage that was taken out on this home.
Original Mortgage
$132,000
Interest Rate
7.59%
Purchase Details
Closed on
Sep 6, 1994
Sold by
Abujudeh Najeeb and Judeh Samira N Abu
Bought by
Emc Mtg Corp
Create a Home Valuation Report for This Property
The Home Valuation Report is an in-depth analysis detailing your home's value as well as a comparison with similar homes in the area
Home Values in the Area
Average Home Value in this Area
Purchase History
| Date | Buyer | Sale Price | Title Company |
|---|---|---|---|
| Blaylock Michael D | -- | Gateway Title Company | |
| Blaylock Michael D | -- | Continental Lawyers Title Co | |
| Blaylock Michael D | $139,000 | Continental Lawyers Title Co | |
| Emc Mtg Corp | $145,000 | First Southwestern Title |
Source: Public Records
Mortgage History
| Date | Status | Borrower | Loan Amount |
|---|---|---|---|
| Open | Blaylock Michael D | $233,750 | |
| Previous Owner | Blaylock Michael D | $132,000 |
Source: Public Records
Tax History Compared to Growth
Tax History
| Year | Tax Paid | Tax Assessment Tax Assessment Total Assessment is a certain percentage of the fair market value that is determined by local assessors to be the total taxable value of land and additions on the property. | Land | Improvement |
|---|---|---|---|---|
| 2025 | $4,004 | $305,309 | $249,177 | $56,132 |
| 2024 | $4,004 | $299,324 | $244,292 | $55,032 |
| 2023 | $3,967 | $293,455 | $239,502 | $53,953 |
| 2022 | $3,837 | $287,702 | $234,806 | $52,896 |
| 2021 | $3,619 | $282,061 | $230,202 | $51,859 |
| 2019 | $3,492 | $273,697 | $223,375 | $50,322 |
| 2018 | $3,446 | $268,332 | $218,996 | $49,336 |
| 2016 | $3,330 | $257,914 | $210,493 | $47,421 |
| 2015 | $3,294 | $254,041 | $207,332 | $46,709 |
| 2014 | $3,237 | $249,066 | $203,271 | $45,795 |
Source: Public Records
Map
Nearby Homes
- 803 Morada Place
- 778 Alameda St
- 2034 El Molino Ave
- 2097 El Molino Ave
- 2117 N Madison Ave
- 287 287 E Calaveras St
- 2030 Lovila Ln
- 672 Colman St
- 591 Alameda St
- 1920 Maiden Ln
- 1052 New York Dr
- 1862 N Madison Ave
- 917 E Mendocino St
- 2263 Mar Vista Ave
- 2186 Mar Vista Ave
- 1766 N Madison Ave
- 1840 Santa Rosa Ave
- 451 E Sacramento St
- 2490 N Lake Ave
- 1955 N Los Robles Ave
- 828 Morada Place
- 810 Morada Place
- 807 E Sacramento St
- 804 Morada Place
- 840 Morada Place
- 794 Morada Place
- 801 E Sacramento St
- 819 E Sacramento St
- 819 Morada Place
- 827 Morada Place
- 848 Morada Place
- 809 Morada Place
- 788 Morada Place
- 777 E Sacramento St
- 835 Morada Place
- 825 E Sacramento St
- 843 Morada Place
- 856 Morada Place
- 833 E Sacramento St
- 780 Morada Place