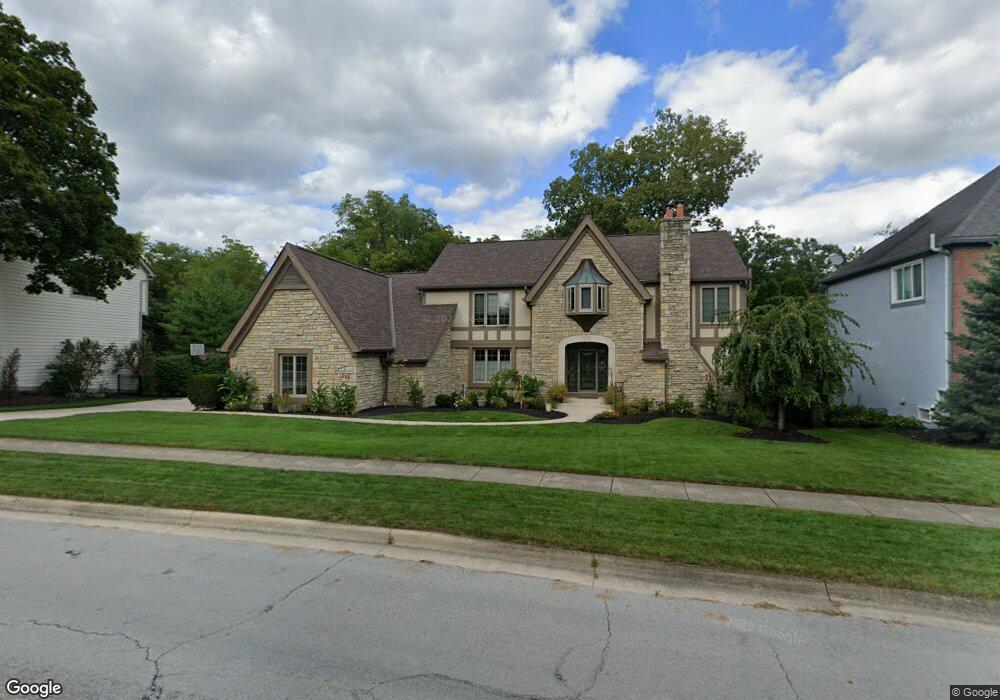
818 Pipestone Dr Columbus, OH 43235
Estimated Value: $860,613 - $948,000
5
Beds
4
Baths
4,478
Sq Ft
$200/Sq Ft
Est. Value
About This Home
This home is located at 818 Pipestone Dr, Columbus, OH 43235 and is currently estimated at $895,903, approximately $200 per square foot. 818 Pipestone Dr is a home located in Franklin County with nearby schools including Worthington Hills Elementary School, McCord Middle School, and Worthington Kilbourne High School.
Ownership History
Date
Name
Owned For
Owner Type
Purchase Details
Closed on
May 15, 2015
Sold by
Miller Kaylyn E
Bought by
Miller Lisa A
Current Estimated Value
Purchase Details
Closed on
Jun 30, 2004
Sold by
Trzeciak Marc A and Trzeciak Miriam
Bought by
Miller Nicholas D and Miller Lisa A
Home Financials for this Owner
Home Financials are based on the most recent Mortgage that was taken out on this home.
Original Mortgage
$333,700
Interest Rate
5.74%
Mortgage Type
Purchase Money Mortgage
Purchase Details
Closed on
Nov 30, 1998
Sold by
Anderson Larry R and Anderson Deborah S
Bought by
Trzeciak Marc and Trzeciak Miriam
Home Financials for this Owner
Home Financials are based on the most recent Mortgage that was taken out on this home.
Original Mortgage
$370,800
Interest Rate
6.8%
Purchase Details
Closed on
Jan 27, 1984
Bought by
Anderson Larry R
Purchase Details
Closed on
May 1, 1983
Create a Home Valuation Report for This Property
The Home Valuation Report is an in-depth analysis detailing your home's value as well as a comparison with similar homes in the area
Home Values in the Area
Average Home Value in this Area
Purchase History
| Date | Buyer | Sale Price | Title Company |
|---|---|---|---|
| Miller Lisa A | -- | Attorney | |
| Miller Nicholas D | $533,500 | Title First | |
| Trzeciak Marc | $412,000 | Celtic Title Agency Inc | |
| Anderson Larry R | $270,500 | -- | |
| -- | $55,000 | -- |
Source: Public Records
Mortgage History
| Date | Status | Borrower | Loan Amount |
|---|---|---|---|
| Closed | Miller Nicholas D | $333,700 | |
| Closed | Trzeciak Marc | $370,800 |
Source: Public Records
Tax History Compared to Growth
Tax History
| Year | Tax Paid | Tax Assessment Tax Assessment Total Assessment is a certain percentage of the fair market value that is determined by local assessors to be the total taxable value of land and additions on the property. | Land | Improvement |
|---|---|---|---|---|
| 2024 | $16,007 | $260,720 | $69,830 | $190,890 |
| 2023 | $15,307 | $260,715 | $69,825 | $190,890 |
| 2022 | $16,284 | $220,080 | $37,800 | $182,280 |
| 2021 | $15,023 | $220,080 | $37,800 | $182,280 |
| 2020 | $14,470 | $220,080 | $37,800 | $182,280 |
| 2019 | $13,254 | $181,900 | $31,500 | $150,400 |
| 2018 | $6,420 | $181,900 | $31,500 | $150,400 |
| 2017 | $11,877 | $181,900 | $31,500 | $150,400 |
| 2016 | $12,865 | $181,200 | $32,620 | $148,580 |
| 2015 | $6,433 | $181,200 | $32,620 | $148,580 |
| 2014 | $12,862 | $181,200 | $32,620 | $148,580 |
| 2013 | $6,045 | $171,150 | $29,645 | $141,505 |
Source: Public Records
Map
Nearby Homes
- 865 Colony Way
- 941 Clubview Blvd S
- 7522 Acela St
- 1101 Bluffway Dr
- 1539 Clubview Blvd S
- 1483 Dogwood Loop
- Fiona B Plan at Loch Lomond - Loch Lomond Hills
- 1474 Dogwood Loop
- Fiona A Plan at Loch Lomond - Loch Lomond Hills
- Fiona D Plan at Loch Lomond - Loch Lomond Hills
- Fiona C Plan at Loch Lomond - Loch Lomond Hills
- 90 Northwoods Blvd Unit B
- 67 Highland Pointe Cir Unit 67
- 8208 Copperfield Dr
- 8326 Bruntsfield Rd
- 8292 Breckenridge Way
- 1967 Woodlands Place
- 8205 Longhorn Rd
- 1592 Newcomer Rd
- 1380 Tiehack Ct
- 810 Pipestone Dr
- 826 Pipestone Dr
- 795 Old Oak Trace
- 783 Old Oak Trace
- 821 Pipestone Dr
- 771 Old Oak Trace Unit 3
- 7732 Norhill Rd
- 829 Pipestone Dr
- 809 Colony Ct
- 834 Pipestone Dr
- 799 Colony Ct
- 832 Cherryfield Ave
- 837 Pipestone Dr
- 817 Colony Ct
- 7711 Norhill Rd
- 7718 Norhill Rd
- 759 Old Oak Trace
- 759 Old Oak Trace Unit 4
- 815 Cherryfield Ave
- 747 Colony Ct