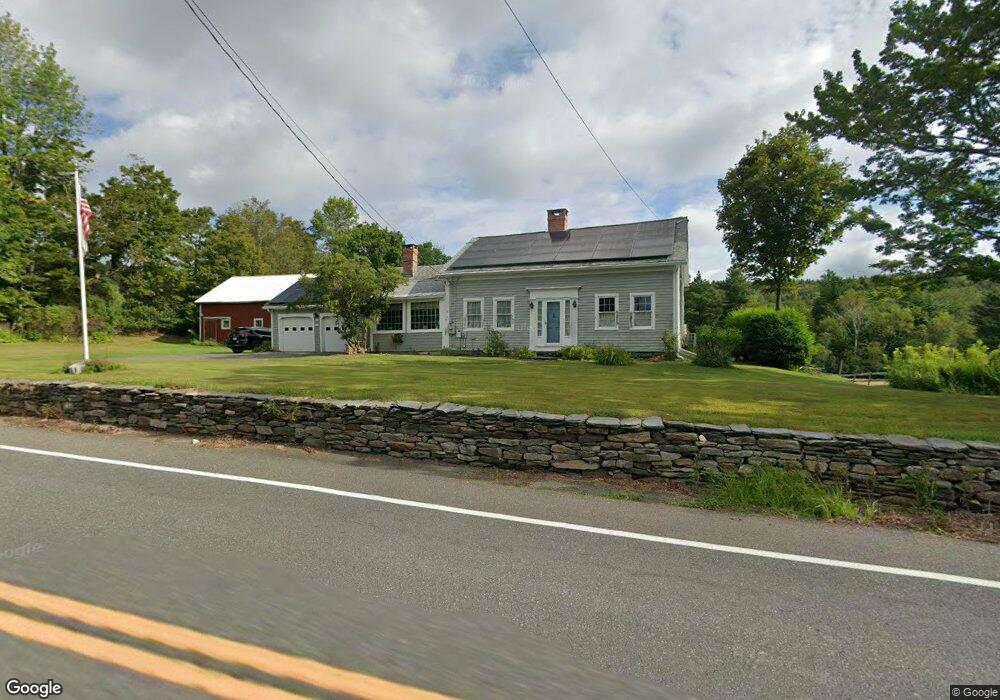
818 W Main St Plainfield, MA 01070
Estimated Value: $403,545 - $482,000
3
Beds
2
Baths
2,192
Sq Ft
$199/Sq Ft
Est. Value
About This Home
This home is located at 818 W Main St, Plainfield, MA 01070 and is currently estimated at $436,515, approximately $199 per square foot. 818 W Main St is a home located in Hampshire County with nearby schools including Mohawk Trail Regional High School.
Ownership History
Date
Name
Owned For
Owner Type
Purchase Details
Closed on
May 5, 2025
Sold by
Honneus David C and Honneus Susan M
Bought by
Honneus Plainfield Ft and Honneus
Current Estimated Value
Purchase Details
Closed on
Apr 19, 2022
Sold by
Metcalfe-Larock Susan
Bought by
Metcale-Honneus Susan and Honneus David C
Home Financials for this Owner
Home Financials are based on the most recent Mortgage that was taken out on this home.
Original Mortgage
$40,000
Interest Rate
3.85%
Mortgage Type
New Conventional
Purchase Details
Closed on
Jun 12, 2006
Sold by
Larock Leroy L
Bought by
Metcalfe Kathryn D and Metcalfe-Larock Susan
Create a Home Valuation Report for This Property
The Home Valuation Report is an in-depth analysis detailing your home's value as well as a comparison with similar homes in the area
Home Values in the Area
Average Home Value in this Area
Purchase History
| Date | Buyer | Sale Price | Title Company |
|---|---|---|---|
| Honneus Plainfield Ft | -- | None Available | |
| Honneus Plainfield Ft | -- | None Available | |
| Metcale-Honneus Susan | -- | None Available | |
| Metcale-Honneus Susan | -- | None Available | |
| Metcalfe Kathryn D | -- | -- | |
| Metcalfe Kathryn D | -- | -- |
Source: Public Records
Mortgage History
| Date | Status | Borrower | Loan Amount |
|---|---|---|---|
| Previous Owner | Metcale-Honneus Susan | $40,000 | |
| Previous Owner | Metcalfe Kathryn D | $180,000 | |
| Previous Owner | Metcalfe Kathryn D | $285,000 | |
| Previous Owner | Metcalfe Kathryn D | $191,533 |
Source: Public Records
Tax History
| Year | Tax Paid | Tax Assessment Tax Assessment Total Assessment is a certain percentage of the fair market value that is determined by local assessors to be the total taxable value of land and additions on the property. | Land | Improvement |
|---|---|---|---|---|
| 2025 | $5,196 | $281,142 | $41,442 | $239,700 |
| 2024 | $4,586 | $214,096 | $42,296 | $171,800 |
| 2023 | $4,436 | $214,096 | $42,296 | $171,800 |
| 2022 | $4,271 | $214,096 | $42,296 | $171,800 |
| 2021 | $4,095 | $212,830 | $41,130 | $171,700 |
| 2020 | $4,384 | $217,900 | $45,000 | $172,900 |
| 2019 | $4,121 | $212,200 | $43,600 | $168,600 |
| 2018 | $3,976 | $208,400 | $39,700 | $168,700 |
| 2017 | $3,692 | $189,700 | $40,000 | $149,700 |
| 2016 | $3,631 | $192,500 | $40,300 | $152,200 |
| 2015 | $3,452 | $193,600 | $46,100 | $147,500 |
| 2014 | $3,372 | $188,600 | $45,200 | $143,400 |
Source: Public Records
Map
Nearby Homes
Your Personal Tour Guide
Ask me questions while you tour the home.