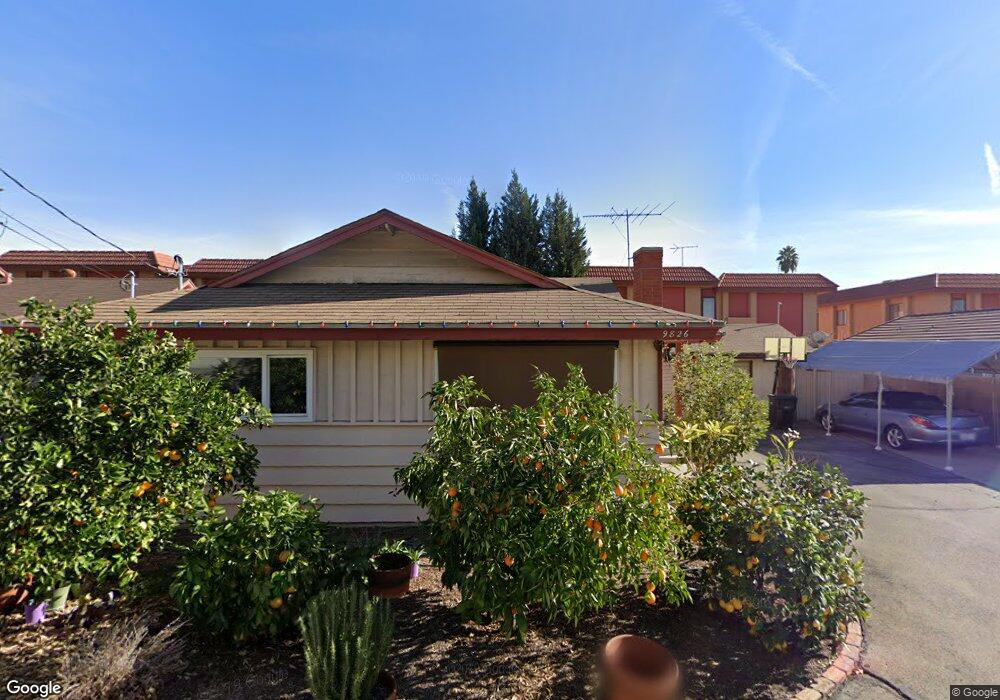
818 W Naomi Ave Unit 2 Arcadia, CA 91007
Estimated Value: $811,989 - $985,000
2
Beds
3
Baths
1,642
Sq Ft
$546/Sq Ft
Est. Value
About This Home
This home is located at 818 W Naomi Ave Unit 2, Arcadia, CA 91007 and is currently estimated at $896,997, approximately $546 per square foot. 818 W Naomi Ave Unit 2 is a home located in Los Angeles County with nearby schools including Longden Elementary School, Oak Avenue Intermediate School, and Temple City High School.
Ownership History
Date
Name
Owned For
Owner Type
Purchase Details
Closed on
Mar 30, 2009
Sold by
Yu Nien Chu George and Yu Joyce Wei Tai
Bought by
Yu Nien Chu George and Yu Joyce Wei Tai
Current Estimated Value
Home Financials for this Owner
Home Financials are based on the most recent Mortgage that was taken out on this home.
Original Mortgage
$380,000
Outstanding Balance
$241,765
Interest Rate
5.06%
Mortgage Type
New Conventional
Estimated Equity
$655,232
Purchase Details
Closed on
Aug 18, 2003
Sold by
Chen Alan Chiu Chang
Bought by
Yu Nien Chu George and Yu Nien Teh Eagle
Home Financials for this Owner
Home Financials are based on the most recent Mortgage that was taken out on this home.
Original Mortgage
$292,000
Interest Rate
5.46%
Mortgage Type
Purchase Money Mortgage
Create a Home Valuation Report for This Property
The Home Valuation Report is an in-depth analysis detailing your home's value as well as a comparison with similar homes in the area
Home Values in the Area
Average Home Value in this Area
Purchase History
We collect this data history from publicly available records. To have your information removed, we recommend requesting removal directly through your county’s website.
| Date | Buyer | Sale Price | Title Company |
|---|---|---|---|
| Yu Nien Chu George | -- | Fidelity National Title Co | |
| Yu Nien Chu George | $370,000 | Investors Title Company |
Source: Public Records
Mortgage History
We collect this data history from publicly available records. To have your information removed, we recommend requesting removal directly through your county’s website.
| Date | Status | Borrower | Loan Amount |
|---|---|---|---|
| Open | Yu Nien Chu George | $380,000 | |
| Closed | Yu Nien Chu George | $292,000 | |
| Closed | Yu Nien Chu George | $34,000 |
Source: Public Records
Tax History
| Year | Tax Paid | Tax Assessment Tax Assessment Total Assessment is a certain percentage of the fair market value that is determined by local assessors to be the total taxable value of land and additions on the property. | Land | Improvement |
|---|---|---|---|---|
| 2025 | $6,522 | $552,819 | $296,707 | $256,112 |
| 2024 | $6,439 | $541,981 | $290,890 | $251,091 |
| 2023 | $6,297 | $531,355 | $285,187 | $246,168 |
| 2022 | $5,882 | $520,938 | $279,596 | $241,342 |
| 2021 | $5,992 | $510,724 | $274,114 | $236,610 |
| 2019 | $5,774 | $495,578 | $265,985 | $229,593 |
| 2018 | $5,652 | $485,862 | $260,770 | $225,092 |
| 2016 | $5,410 | $466,997 | $250,645 | $216,352 |
| 2015 | $5,316 | $459,984 | $246,881 | $213,103 |
| 2014 | $5,243 | $450,974 | $242,045 | $208,929 |
Source: Public Records
Map
Nearby Homes
- 6718 N Golden West Ave
- 1231 S Golden Ave W Unit 11
- 1231 S Golden West Ave Unit 3
- 1211 S Golden West Ave Unit C
- 905 W Duarte Rd Unit A
- 9656 Ardendale Ave
- 750 Arcadia Ave Unit 7
- 1522 S Baldwin Ave Unit 10
- 1222 Temple City Blvd
- 1006 Arcadia Ave Unit D
- 1027 Arcadia Ave Unit C
- 1088 Sunset Blvd Unit A
- 747 Fairview Ave Unit A
- 6421 Golden West Ave
- 536 W Camino Real Ave
- 1140 Arcadia Ave
- 905 Sunset Blvd Unit A
- 848 W Huntington Dr Unit 23
- 535 W Duarte Rd Unit 5
- 830 Sunset Blvd Unit A
- 828 W Naomi Ave Unit B
- 828 W Naomi Ave Unit A
- 828 W Naomi Ave Unit C
- 9828 E Naomi Ave
- 9826 E Naomi Ave
- 836 W Naomi Ave Unit D
- 836 W Naomi Ave Unit C
- 836 W Naomi Ave Unit B
- 836 W Naomi Ave Unit A
- 832 W Naomi Ave Unit D
- 832 W Naomi Ave Unit C
- 832 W Naomi Ave Unit B
- 832 W Naomi Ave Unit A
- 816 W Naomi Ave Unit 18
- 816 W Naomi Ave Unit 17
- 816 W Naomi Ave Unit 16
- 816 W Naomi Ave Unit 15
- 816 W Naomi Ave Unit 14
- 816 W Naomi Ave Unit 13
- 816 W Naomi Ave Unit 12
Your Personal Tour Guide
Ask me questions while you tour the home.