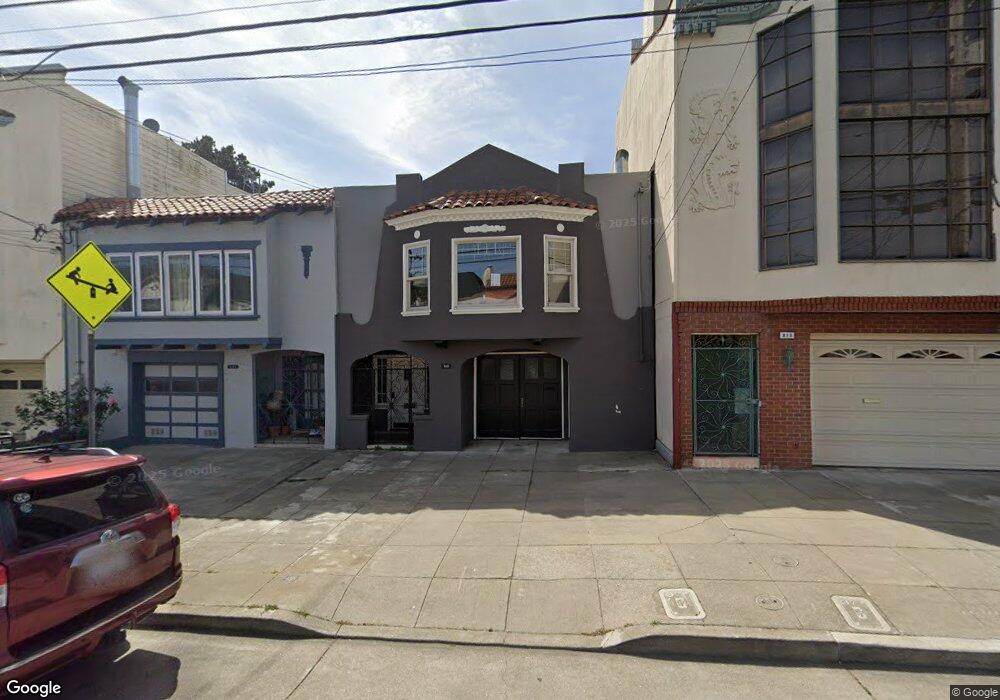
819 27th Ave San Francisco, CA 94121
Central Richmond NeighborhoodEstimated Value: $1,421,000 - $1,837,000
3
Beds
2
Baths
1,410
Sq Ft
$1,144/Sq Ft
Est. Value
About This Home
This home is located at 819 27th Ave, San Francisco, CA 94121 and is currently estimated at $1,613,628, approximately $1,144 per square foot. 819 27th Ave is a home located in San Francisco County with nearby schools including Argonne Elementary School, Presidio Middle School, and Bais Menachem Yeshiva Day School.
Ownership History
Date
Name
Owned For
Owner Type
Purchase Details
Closed on
Nov 17, 2017
Sold by
Taber David O
Bought by
Sallaberrry Michael and Perez Sallaberry Yvonne
Current Estimated Value
Home Financials for this Owner
Home Financials are based on the most recent Mortgage that was taken out on this home.
Original Mortgage
$750,000
Outstanding Balance
$616,475
Interest Rate
3.15%
Mortgage Type
Adjustable Rate Mortgage/ARM
Estimated Equity
$997,153
Purchase Details
Closed on
Oct 5, 2017
Sold by
Mueller Carol A and Mueller Harold F
Bought by
Mueller Carol A
Home Financials for this Owner
Home Financials are based on the most recent Mortgage that was taken out on this home.
Original Mortgage
$750,000
Outstanding Balance
$616,475
Interest Rate
3.15%
Mortgage Type
Adjustable Rate Mortgage/ARM
Estimated Equity
$997,153
Purchase Details
Closed on
Jan 8, 1999
Sold by
Taber Gioia C
Bought by
The Gioia C Taber Revocable Trust
Create a Home Valuation Report for This Property
The Home Valuation Report is an in-depth analysis detailing your home's value as well as a comparison with similar homes in the area
Home Values in the Area
Average Home Value in this Area
Purchase History
| Date | Buyer | Sale Price | Title Company |
|---|---|---|---|
| Sallaberrry Michael | $1,400,000 | Fidelity Title Co Concord | |
| Mueller Carol A | -- | Fidelity National Title Co | |
| The Gioia C Taber Revocable Trust | -- | -- |
Source: Public Records
Mortgage History
| Date | Status | Borrower | Loan Amount |
|---|---|---|---|
| Open | Sallaberrry Michael | $750,000 |
Source: Public Records
Tax History Compared to Growth
Tax History
| Year | Tax Paid | Tax Assessment Tax Assessment Total Assessment is a certain percentage of the fair market value that is determined by local assessors to be the total taxable value of land and additions on the property. | Land | Improvement |
|---|---|---|---|---|
| 2025 | $19,002 | $1,592,956 | $1,115,071 | $477,885 |
| 2024 | $19,002 | $1,561,722 | $1,093,207 | $468,515 |
| 2023 | $18,715 | $1,531,101 | $1,071,772 | $459,329 |
| 2022 | $18,359 | $1,501,080 | $1,050,757 | $450,323 |
| 2021 | $18,033 | $1,471,648 | $1,030,154 | $441,494 |
| 2020 | $18,113 | $1,456,560 | $1,019,592 | $436,968 |
| 2019 | $17,490 | $1,428,000 | $999,600 | $428,400 |
| 2018 | $16,899 | $1,400,000 | $980,000 | $420,000 |
| 2017 | $1,238 | $79,179 | $38,988 | $40,191 |
| 2016 | $1,185 | $77,627 | $38,224 | $39,403 |
| 2015 | $1,167 | $76,462 | $37,650 | $38,812 |
| 2014 | $1,136 | $74,965 | $36,913 | $38,052 |
Source: Public Records
Map
Nearby Homes
- 874 27th Ave
- 880 26th Ave Unit 5
- 880 26th Ave Unit 2
- 880 26th Ave
- 882-884 26th Ave
- 5600 Fulton St
- 647 24th Ave
- 576 27th Ave
- 2133 Balboa St
- 574 26th Ave Unit 3
- 668 33rd Ave
- 765 21st Ave
- 716 35th Ave
- 5924 Fulton St
- 2725 Clement St
- 439 32nd Ave
- 7039 Geary Blvd
- 870-872 38th Ave
- 2205 Clement St
- 1633 Cabrillo St