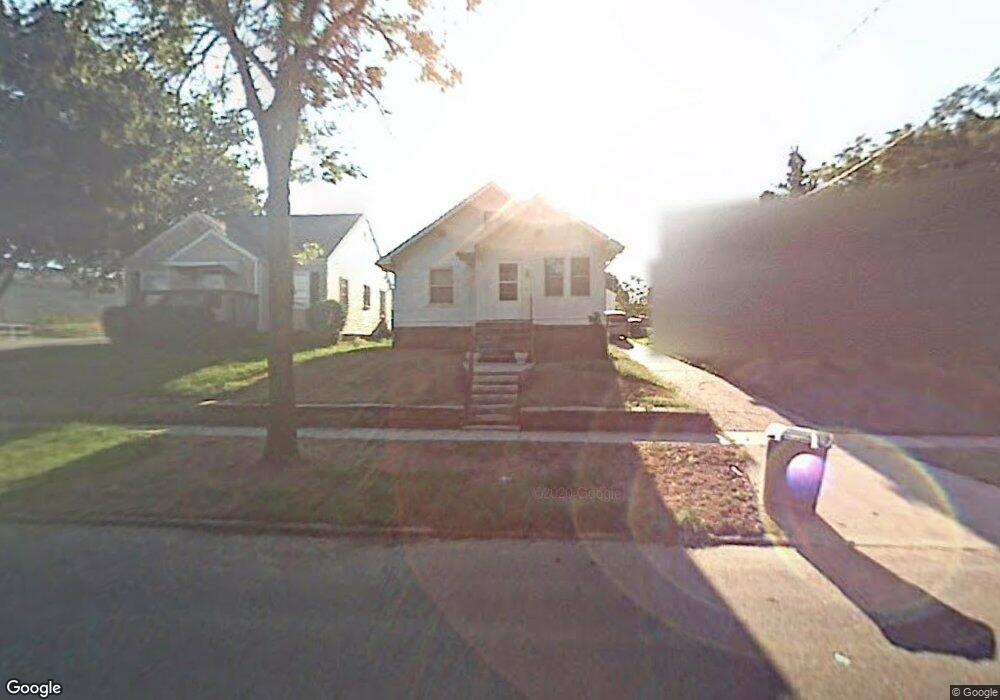
819 33rd St Des Moines, IA 50312
North of Grand NeighborhoodEstimated Value: $128,000 - $199,000
2
Beds
1
Bath
1,249
Sq Ft
$137/Sq Ft
Est. Value
About This Home
This home is located at 819 33rd St, Des Moines, IA 50312 and is currently estimated at $171,451, approximately $137 per square foot. 819 33rd St is a home located in Polk County with nearby schools including Greenwood Elementary School, Roosevelt High School, and St Augustin Catholic School.
Ownership History
Date
Name
Owned For
Owner Type
Purchase Details
Closed on
Apr 22, 2021
Sold by
Dredske Duane R and Dredske Patricia A
Bought by
Dredske William R
Current Estimated Value
Purchase Details
Closed on
Oct 29, 2009
Sold by
Dredske Duane R and Dredske Patricia A
Bought by
Dredske William R
Home Financials for this Owner
Home Financials are based on the most recent Mortgage that was taken out on this home.
Original Mortgage
$43,000
Interest Rate
5.07%
Mortgage Type
Seller Take Back
Purchase Details
Closed on
May 8, 1997
Sold by
Heuton Bobby D and Heuton Karen K
Bought by
Dredske Duane R and Dredske Patricia A
Create a Home Valuation Report for This Property
The Home Valuation Report is an in-depth analysis detailing your home's value as well as a comparison with similar homes in the area
Home Values in the Area
Average Home Value in this Area
Purchase History
| Date | Buyer | Sale Price | Title Company |
|---|---|---|---|
| Dredske William R | $45,000 | None Available | |
| Dredske William R | $45,000 | None Available | |
| Dredske Duane R | $31,500 | -- |
Source: Public Records
Mortgage History
| Date | Status | Borrower | Loan Amount |
|---|---|---|---|
| Previous Owner | Dredske William R | $43,000 |
Source: Public Records
Tax History Compared to Growth
Tax History
| Year | Tax Paid | Tax Assessment Tax Assessment Total Assessment is a certain percentage of the fair market value that is determined by local assessors to be the total taxable value of land and additions on the property. | Land | Improvement |
|---|---|---|---|---|
| 2025 | $2,238 | $139,100 | $38,400 | $100,700 |
| 2024 | $2,238 | $132,900 | $36,600 | $96,300 |
| 2023 | $2,216 | $132,900 | $36,600 | $96,300 |
| 2022 | $2,196 | $106,300 | $30,300 | $76,000 |
| 2021 | $2,072 | $106,300 | $30,300 | $76,000 |
| 2020 | $2,144 | $94,900 | $27,200 | $67,700 |
| 2019 | $1,968 | $94,900 | $27,200 | $67,700 |
| 2018 | $1,940 | $85,000 | $24,300 | $60,700 |
| 2017 | $1,766 | $85,000 | $24,300 | $60,700 |
| 2016 | $1,714 | $77,100 | $21,800 | $55,300 |
| 2015 | $1,714 | $77,100 | $21,800 | $55,300 |
| 2014 | $1,636 | $73,600 | $20,800 | $52,800 |
Source: Public Records
Map
Nearby Homes