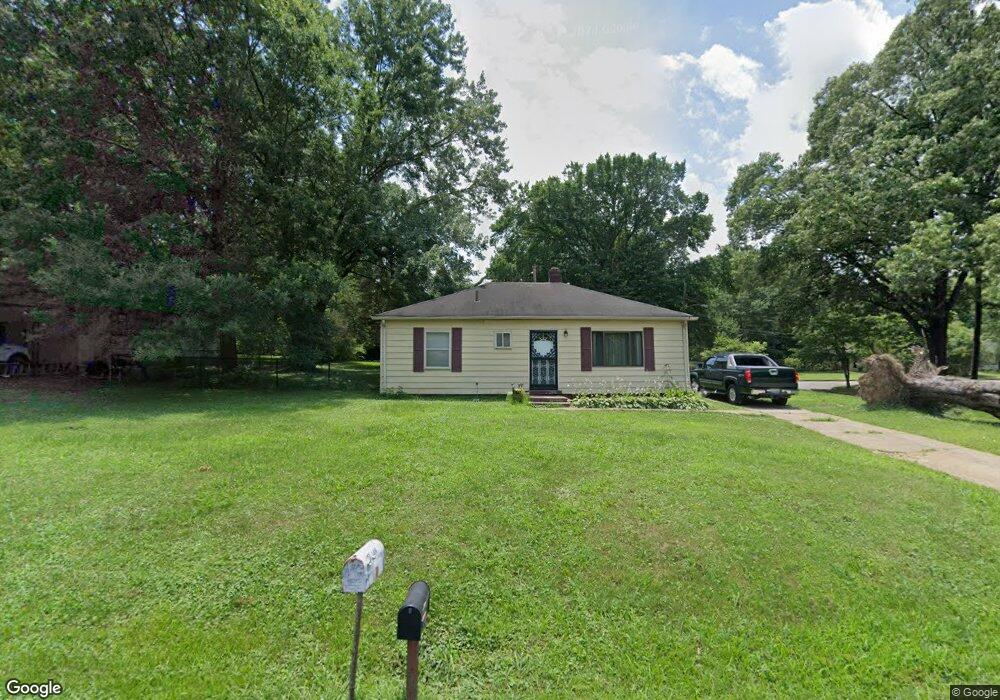
819 Floyd Ave Memphis, TN 38127
Frayser NeighborhoodEstimated Value: $64,320 - $78,000
3
Beds
1
Bath
1,035
Sq Ft
$71/Sq Ft
Est. Value
About This Home
This home is located at 819 Floyd Ave, Memphis, TN 38127 and is currently estimated at $73,580, approximately $71 per square foot. 819 Floyd Ave is a home located in Shelby County with nearby schools including Westside Elementary School, Grandview Heights Middle, and Trezevant High School.
Ownership History
Date
Name
Owned For
Owner Type
Purchase Details
Closed on
Jun 22, 2001
Sold by
Fowler James David
Bought by
Anderson Michelle R
Current Estimated Value
Home Financials for this Owner
Home Financials are based on the most recent Mortgage that was taken out on this home.
Original Mortgage
$40,092
Outstanding Balance
$15,092
Interest Rate
7.14%
Estimated Equity
$58,488
Create a Home Valuation Report for This Property
The Home Valuation Report is an in-depth analysis detailing your home's value as well as a comparison with similar homes in the area
Home Values in the Area
Average Home Value in this Area
Purchase History
| Date | Buyer | Sale Price | Title Company |
|---|---|---|---|
| Anderson Michelle R | $40,000 | -- | |
| Anderson Michelle R | $40,000 | -- |
Source: Public Records
Mortgage History
| Date | Status | Borrower | Loan Amount |
|---|---|---|---|
| Open | Anderson Michelle R | $40,092 | |
| Closed | Anderson Michelle R | $40,092 | |
| Closed | Anderson Michelle R | $2,746 |
Source: Public Records
Tax History
| Year | Tax Paid | Tax Assessment Tax Assessment Total Assessment is a certain percentage of the fair market value that is determined by local assessors to be the total taxable value of land and additions on the property. | Land | Improvement |
|---|---|---|---|---|
| 2025 | $371 | $15,875 | $1,625 | $14,250 |
| 2024 | $371 | $10,950 | $1,275 | $9,675 |
| 2023 | $667 | $10,950 | $1,275 | $9,675 |
| 2022 | $667 | $10,950 | $1,275 | $9,675 |
| 2021 | $675 | $10,950 | $1,275 | $9,675 |
| 2020 | $527 | $7,275 | $1,275 | $6,000 |
| 2019 | $527 | $7,275 | $1,275 | $6,000 |
| 2018 | $527 | $7,275 | $1,275 | $6,000 |
| 2017 | $299 | $7,275 | $1,275 | $6,000 |
| 2016 | $380 | $8,700 | $0 | $0 |
| 2014 | $380 | $8,700 | $0 | $0 |
Source: Public Records
Map
Nearby Homes
Your Personal Tour Guide
Ask me questions while you tour the home.