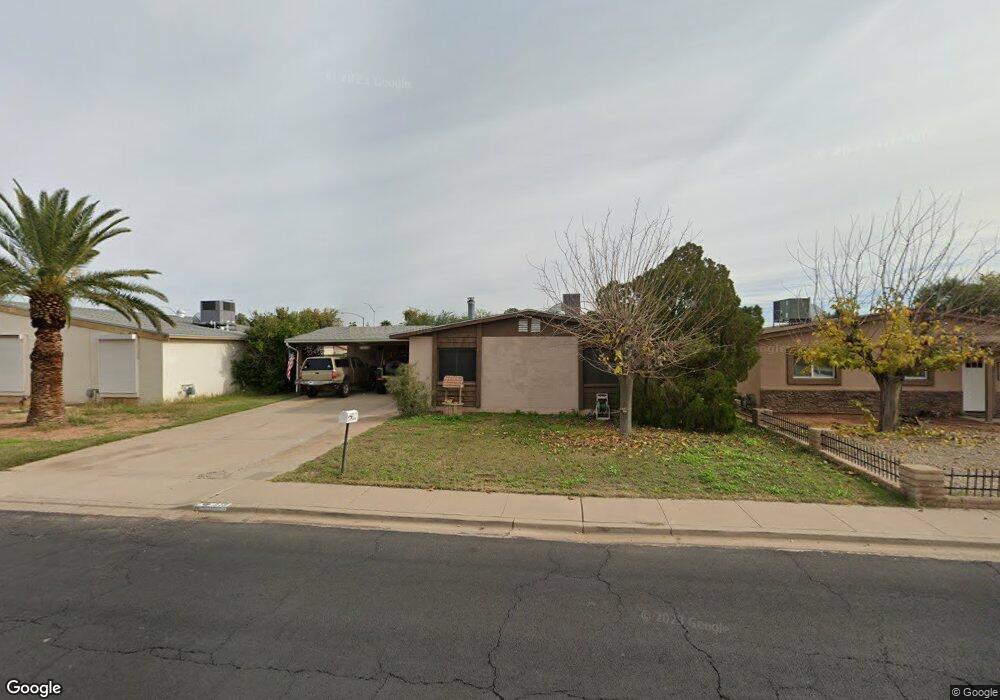
819 S Kachina Mesa, AZ 85204
Reed Park NeighborhoodEstimated Value: $372,000 - $431,000
3
Beds
2
Baths
1,271
Sq Ft
$309/Sq Ft
Est. Value
About This Home
This home is located at 819 S Kachina, Mesa, AZ 85204 and is currently estimated at $392,733, approximately $308 per square foot. 819 S Kachina is a home located in Maricopa County with nearby schools including Lindbergh Elementary School, Franklin at Brimhall Elementary School, and Franklin West Elementary School.
Ownership History
Date
Name
Owned For
Owner Type
Purchase Details
Closed on
Aug 21, 2001
Sold by
Stinson Willie C and Stinson Deborah A
Bought by
Stirnaman Danny Lee
Current Estimated Value
Home Financials for this Owner
Home Financials are based on the most recent Mortgage that was taken out on this home.
Original Mortgage
$108,926
Outstanding Balance
$42,029
Interest Rate
7%
Mortgage Type
FHA
Estimated Equity
$350,704
Purchase Details
Closed on
Jun 5, 1998
Sold by
Sennett Mary Catherine
Bought by
Stinson Willie C and Stinson Deborah A
Home Financials for this Owner
Home Financials are based on the most recent Mortgage that was taken out on this home.
Original Mortgage
$84,550
Interest Rate
7.17%
Mortgage Type
New Conventional
Purchase Details
Closed on
Jul 19, 1994
Sold by
Bednarz John Grant
Bought by
Sennett Mary Catherine
Create a Home Valuation Report for This Property
The Home Valuation Report is an in-depth analysis detailing your home's value as well as a comparison with similar homes in the area
Home Values in the Area
Average Home Value in this Area
Purchase History
| Date | Buyer | Sale Price | Title Company |
|---|---|---|---|
| Stirnaman Danny Lee | $109,900 | Security Title Agency | |
| Stinson Willie C | $89,000 | Stewart Title & Trust | |
| Sennett Mary Catherine | -- | -- |
Source: Public Records
Mortgage History
| Date | Status | Borrower | Loan Amount |
|---|---|---|---|
| Open | Stirnaman Danny Lee | $108,926 | |
| Previous Owner | Stinson Willie C | $84,550 |
Source: Public Records
Tax History Compared to Growth
Tax History
| Year | Tax Paid | Tax Assessment Tax Assessment Total Assessment is a certain percentage of the fair market value that is determined by local assessors to be the total taxable value of land and additions on the property. | Land | Improvement |
|---|---|---|---|---|
| 2025 | $830 | $9,990 | -- | -- |
| 2024 | $839 | $9,515 | -- | -- |
| 2023 | $839 | $26,970 | $5,390 | $21,580 |
| 2022 | $820 | $20,730 | $4,140 | $16,590 |
| 2021 | $843 | $19,550 | $3,910 | $15,640 |
| 2020 | $832 | $17,670 | $3,530 | $14,140 |
| 2019 | $770 | $14,810 | $2,960 | $11,850 |
| 2018 | $736 | $13,650 | $2,730 | $10,920 |
| 2017 | $712 | $11,850 | $2,370 | $9,480 |
| 2016 | $700 | $10,620 | $2,120 | $8,500 |
| 2015 | $660 | $9,600 | $1,920 | $7,680 |
Source: Public Records
Map
Nearby Homes
- 908 S Kachina
- 1953 E Marilyn Ave
- 2226 E Diamond Ave
- 2154 E Forge Ave
- 2210 E Forge Ave
- 1521 E Diamond Ave
- 1750 E Mateo Cir Unit 103
- 2245 E Capri Cir
- 1752 E Gable Ave
- 2205 E Garnet Ave
- 1424 E El Moro Ave
- 2456 E Catalina Ave
- 749 S Lazona Dr
- 1844 E Hampton Ave
- 943 S Lazona Dr
- 2253 E Bramble Ave
- 2014 E Bayberry Ave
- 1927 E Hampton Ave Unit 263
- 1927 E Hampton Ave Unit 116
- 1927 E Hampton Ave Unit 260
- 825 S Kachina
- 813 S Kachina
- 1944 E Edgewood Cir
- 807 S Kachina
- 1945 E 8th Ave
- 820 S Kachina
- 814 S Kachina
- 826 S Kachina
- 1950 E Edgewood Cir
- 837 S Kachina
- 1951 E 8th Ave
- 808 S Kachina
- 1952 E Edgewood Cir
- 1945 E Edgewood Cir
- 838 S Kachina
- 1914 E Edgewood Ave
- 843 S Kachina
- 1949 E Edgewood Cir
- 844 S Kachina
- 1932 E 8th Ave