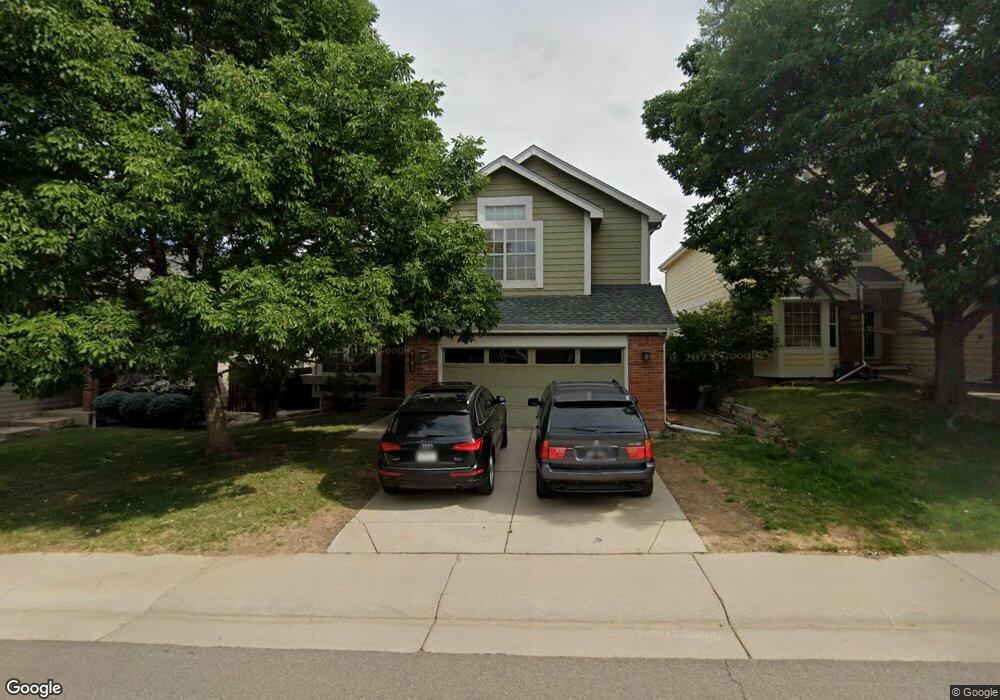
8191 Westside St Littleton, CO 80125
Estimated Value: $528,000 - $616,000
3
Beds
4
Baths
1,909
Sq Ft
$305/Sq Ft
Est. Value
About This Home
This home is located at 8191 Westside St, Littleton, CO 80125 and is currently estimated at $582,895, approximately $305 per square foot. 8191 Westside St is a home located in Douglas County with nearby schools including Roxborough Elementary School, Roxborough Intermediate School, and Ranch View Middle School.
Ownership History
Date
Name
Owned For
Owner Type
Purchase Details
Closed on
Sep 27, 2005
Sold by
Feiser Michael J and Feiser Kim M
Bought by
Sherrill Mark R
Current Estimated Value
Home Financials for this Owner
Home Financials are based on the most recent Mortgage that was taken out on this home.
Original Mortgage
$187,920
Outstanding Balance
$100,583
Interest Rate
5.76%
Mortgage Type
Fannie Mae Freddie Mac
Estimated Equity
$482,312
Purchase Details
Closed on
Sep 30, 1994
Sold by
U S Home Corp
Bought by
Felser Michael J and Felser Kim M
Home Financials for this Owner
Home Financials are based on the most recent Mortgage that was taken out on this home.
Original Mortgage
$125,400
Interest Rate
8.46%
Purchase Details
Closed on
Jan 12, 1994
Sold by
Roxborough Acquisition Corp
Bought by
Us Home Corp
Create a Home Valuation Report for This Property
The Home Valuation Report is an in-depth analysis detailing your home's value as well as a comparison with similar homes in the area
Home Values in the Area
Average Home Value in this Area
Purchase History
| Date | Buyer | Sale Price | Title Company |
|---|---|---|---|
| Sherrill Mark R | $234,900 | Title America | |
| Felser Michael J | $145,930 | First American Heritage Titl | |
| Us Home Corp | $12,300 | -- |
Source: Public Records
Mortgage History
| Date | Status | Borrower | Loan Amount |
|---|---|---|---|
| Open | Sherrill Mark R | $187,920 | |
| Previous Owner | Felser Michael J | $125,400 |
Source: Public Records
Tax History Compared to Growth
Tax History
| Year | Tax Paid | Tax Assessment Tax Assessment Total Assessment is a certain percentage of the fair market value that is determined by local assessors to be the total taxable value of land and additions on the property. | Land | Improvement |
|---|---|---|---|---|
| 2024 | $3,954 | $41,510 | $6,950 | $34,560 |
| 2023 | $3,981 | $41,510 | $6,950 | $34,560 |
| 2022 | $3,036 | $29,020 | $5,190 | $23,830 |
| 2021 | $3,172 | $29,020 | $5,190 | $23,830 |
| 2020 | $3,232 | $27,880 | $6,570 | $21,310 |
| 2019 | $3,283 | $27,880 | $6,570 | $21,310 |
| 2018 | $3,301 | $22,890 | $4,700 | $18,190 |
| 2017 | $3,172 | $22,890 | $4,700 | $18,190 |
| 2016 | $2,978 | $21,230 | $4,120 | $17,110 |
| 2015 | $3,077 | $21,230 | $4,120 | $17,110 |
| 2014 | $2,728 | $17,510 | $2,290 | $15,220 |
Source: Public Records
Map
Nearby Homes
- 8176 Locust Dr
- 8129 Locust Dr
- 10441 Beech St
- 10448 Kicking Horse Dr
- 8109 Mount Ouray Rd
- 7888 Canvasback Cir
- 8032 Mount Ouray Rd
- 7910 Jared Way
- 9804 Rosalee Peak St
- 10594 Wildhorse Ln
- 10565 Kicking Horse Dr
- 9780 Banner Peak St
- 9786 Rosalee Peak St
- 9613 Browns Peak Cir
- 9625 Browns Peak Cir
- 9617 Browns Peak Cir
- Panorama Plan at Prospect Village at Sterling Ranch - Townhomes
- Peak Plan at Prospect Village at Sterling Ranch - Townhomes
- 9753 Middle Peak St
- 8433 Mount Kataka Loop
- 8185 Westside St
- 8197 Westside St
- 8179 Westside St
- 8203 Westside St
- 8190 Westside St
- 8196 Westside St
- 8173 Westside St
- 8178 Westside St
- 8209 Westside St
- 8202 Westside St
- 10223 Little Willow Ct
- 8214 Westside St
- 10167 Lynx Ln
- 8215 Westside St
- 10157 Lynx Ln
- 10177 Lynx Ln
- 10233 Little Willow Ct
- 8226 Westside St
- 8221 Westside St
- 8387 Liverpool Cir