82 Lapham St Fall River, MA 02721
Niagara NeighborhoodEstimated Value: $538,000 - $646,544
9
Beds
3
Baths
3,156
Sq Ft
$187/Sq Ft
Est. Value
About This Home
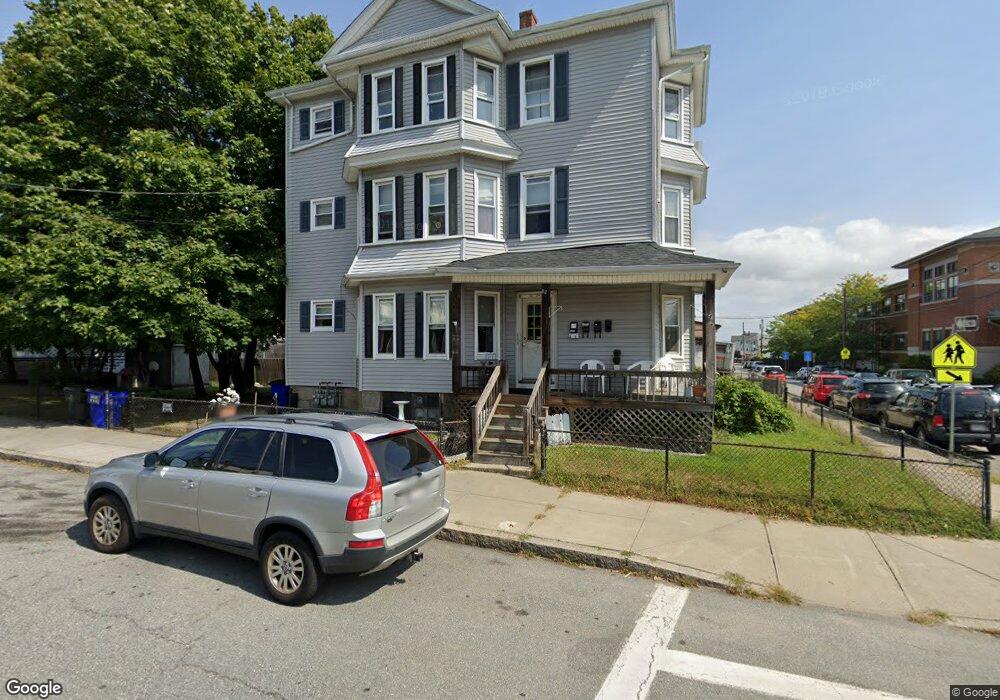
This home is located at 82 Lapham St, Fall River, MA 02721 and is currently estimated at $591,386, approximately $187 per square foot. 82 Lapham St is a home located in Bristol County with nearby schools including William S Greene, Matthew J. Kuss Middle School, and B M C Durfee High School.
Ownership History
Date
Name
Owned For
Owner Type
Purchase Details
Closed on
Oct 15, 1987
Sold by
Mccarthy Norman
Bought by
Pimentel John
Current Estimated Value
Home Financials for this Owner
Home Financials are based on the most recent Mortgage that was taken out on this home.
Original Mortgage
$15,500
Interest Rate
11.13%
Create a Home Valuation Report for This Property
The Home Valuation Report is an in-depth analysis detailing your home's value as well as a comparison with similar homes in the area
Home Values in the Area
Average Home Value in this Area
Purchase History
| Date | Buyer | Sale Price | Title Company |
|---|---|---|---|
| Pimentel John | $135,000 | -- |
Source: Public Records
Mortgage History
| Date | Status | Borrower | Loan Amount |
|---|---|---|---|
| Open | Pimentel John | $200,000 | |
| Closed | Pimentel John | $15,500 | |
| Closed | Pimentel John | $114,000 |
Source: Public Records
Tax History Compared to Growth
Tax History
| Year | Tax Paid | Tax Assessment Tax Assessment Total Assessment is a certain percentage of the fair market value that is determined by local assessors to be the total taxable value of land and additions on the property. | Land | Improvement |
|---|---|---|---|---|
| 2025 | $5,218 | $455,700 | $126,200 | $329,500 |
| 2024 | $4,990 | $434,300 | $121,400 | $312,900 |
| 2023 | $4,371 | $356,200 | $104,100 | $252,100 |
| 2022 | $3,863 | $306,100 | $94,600 | $211,500 |
| 2021 | $3,654 | $264,200 | $87,600 | $176,600 |
| 2020 | $3,293 | $227,900 | $83,800 | $144,100 |
| 2019 | $2,830 | $194,100 | $79,800 | $114,300 |
| 2018 | $2,643 | $180,800 | $78,300 | $102,500 |
| 2017 | $2,554 | $182,400 | $79,900 | $102,500 |
| 2016 | $2,496 | $183,100 | $83,200 | $99,900 |
| 2015 | $2,356 | $180,100 | $80,200 | $99,900 |
| 2014 | $2,439 | $193,900 | $84,400 | $109,500 |
Source: Public Records
Map
Nearby Homes
- 405 Warren St
- 388 Manchester St
- 215 Cambridge St
- 71 Smith St
- 472 Buffinton St
- 472 Buffinton St (Ns)
- 311 S Oxford St
- 11 Foster St
- 192 Snell St
- 364 Tecumseh St
- 31 Niagara St
- 20 Reeves St
- 000 Lawrence St
- 1-11 Lawrence St
- 764 Plymouth Ave
- 1 Lawrence St Unit 1
- 132 Lonsdale St
- 589 Osborn St
- 8 Gladding Place
- 355 Peckham St