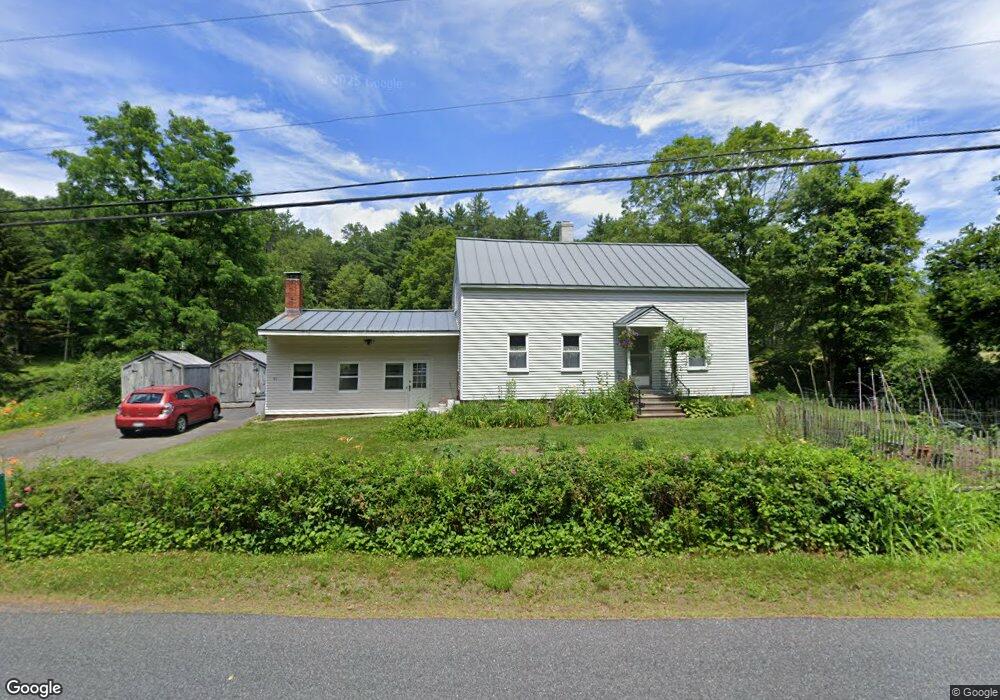
82 S Cross Rd Gill, MA 01354
Gill NeighborhoodEstimated Value: $376,963 - $485,000
4
Beds
2
Baths
1,824
Sq Ft
$238/Sq Ft
Est. Value
About This Home
This home is located at 82 S Cross Rd, Gill, MA 01354 and is currently estimated at $433,491, approximately $237 per square foot. 82 S Cross Rd is a home located in Franklin County with nearby schools including Turners Fall High School, Holy Trinity School, and Greenfield Center School.
Ownership History
Date
Name
Owned For
Owner Type
Purchase Details
Closed on
Oct 14, 2016
Sold by
Foster Fred A and Jane Foster B
Bought by
Int Foster
Current Estimated Value
Purchase Details
Closed on
Jan 11, 2008
Sold by
Est Arial William W Jr and Arial Ronald R
Bought by
Foster B Jane and Foster Fred A
Home Financials for this Owner
Home Financials are based on the most recent Mortgage that was taken out on this home.
Original Mortgage
$130,000
Interest Rate
6.21%
Mortgage Type
Purchase Money Mortgage
Create a Home Valuation Report for This Property
The Home Valuation Report is an in-depth analysis detailing your home's value as well as a comparison with similar homes in the area
Home Values in the Area
Average Home Value in this Area
Purchase History
| Date | Buyer | Sale Price | Title Company |
|---|---|---|---|
| Int Foster | -- | -- | |
| Foster B Jane | $225,000 | -- |
Source: Public Records
Mortgage History
| Date | Status | Borrower | Loan Amount |
|---|---|---|---|
| Previous Owner | Foster B Jane | $130,000 |
Source: Public Records
Tax History
| Year | Tax Paid | Tax Assessment Tax Assessment Total Assessment is a certain percentage of the fair market value that is determined by local assessors to be the total taxable value of land and additions on the property. | Land | Improvement |
|---|---|---|---|---|
| 2025 | $4,896 | $334,000 | $97,400 | $236,600 |
| 2024 | $4,907 | $317,000 | $92,200 | $224,800 |
| 2023 | $4,838 | $286,100 | $83,900 | $202,200 |
| 2022 | $4,328 | $259,800 | $80,100 | $179,700 |
| 2021 | $4,162 | $240,700 | $80,100 | $160,600 |
| 2020 | $3,930 | $227,800 | $76,400 | $151,400 |
| 2019 | $3,871 | $224,300 | $72,900 | $151,400 |
| 2018 | $3,788 | $220,500 | $72,900 | $147,600 |
| 2017 | $3,656 | $220,500 | $72,900 | $147,600 |
| 2016 | $3,618 | $214,700 | $77,400 | $137,300 |
| 2015 | $3,597 | $213,500 | $77,400 | $136,100 |
Source: Public Records
Map
Nearby Homes
- 182 Main Rd
- 20 Walnut St
- 001 Adams Rd
- 0 French King Hwy
- 52 Canada Hill Rd
- 0 Millers Falls Rd Unit 73034825
- 45 Millers Falls Rd
- 63 Davis St
- 696 Bernardston Rd
- 2 Alice St
- 8 Country Club Ln
- 183 Millers Falls Rd
- 23 Sunset Dr
- 805 Fairway Ave
- 709 Fairway Ave
- 47 Cross St
- 20 Merrifield Rd
- 372 Federal St
- 77 Summer St
- 132 Poplar St
Your Personal Tour Guide
Ask me questions while you tour the home.