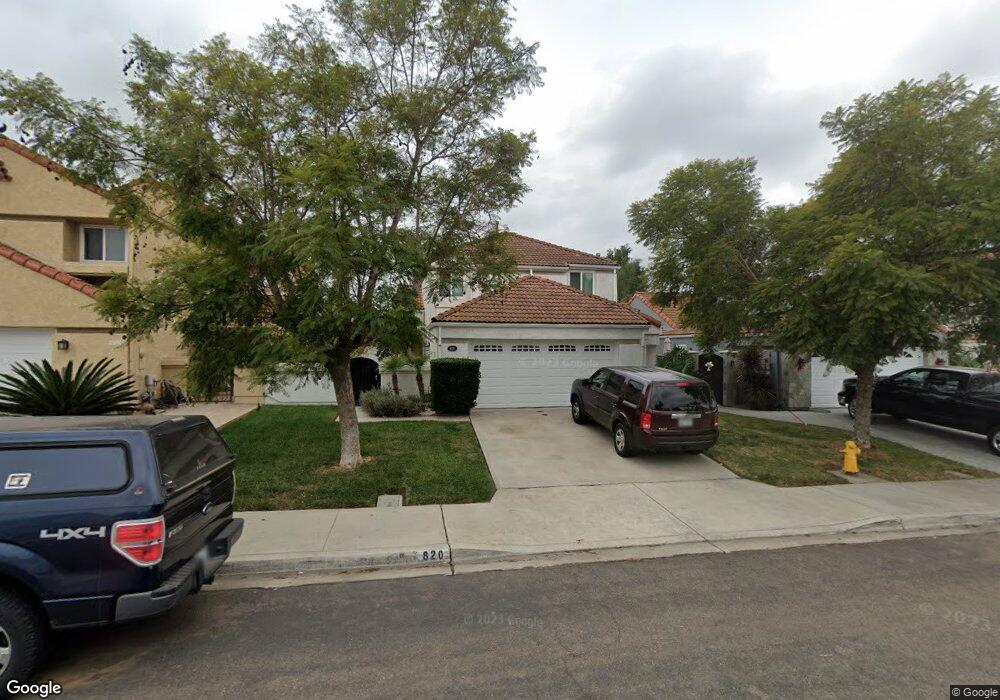
820 Cedarbend Way Chula Vista, CA 91910
Rancho Del Rey NeighborhoodEstimated Value: $889,000 - $968,000
4
Beds
3
Baths
1,778
Sq Ft
$519/Sq Ft
Est. Value
About This Home
This home is located at 820 Cedarbend Way, Chula Vista, CA 91910 and is currently estimated at $923,038, approximately $519 per square foot. 820 Cedarbend Way is a home located in San Diego County with nearby schools including Casillas Elementary School, Rancho Del Rey Middle School, and Otay Ranch Senior High School.
Ownership History
Date
Name
Owned For
Owner Type
Purchase Details
Closed on
Jan 15, 2009
Sold by
Wells Fargo Bank National Association
Bought by
Jaramillo Patrick and Jaramillo Barbara
Current Estimated Value
Home Financials for this Owner
Home Financials are based on the most recent Mortgage that was taken out on this home.
Original Mortgage
$51,000
Outstanding Balance
$32,343
Interest Rate
5.08%
Mortgage Type
Stand Alone Second
Estimated Equity
$890,695
Purchase Details
Closed on
Apr 30, 2008
Sold by
Torres Amanda and Torres Adan
Bought by
Wells Fargo Bank Na
Purchase Details
Closed on
Dec 10, 2007
Sold by
Torres Amanda and Torres Adan
Bought by
Torres Adan
Purchase Details
Closed on
Mar 14, 2005
Sold by
Perez Enrique and Perez Martha
Bought by
Torres Amanda and Torres Adan
Home Financials for this Owner
Home Financials are based on the most recent Mortgage that was taken out on this home.
Original Mortgage
$488,750
Interest Rate
7.05%
Mortgage Type
New Conventional
Purchase Details
Closed on
Sep 13, 1988
Purchase Details
Closed on
May 22, 1985
Create a Home Valuation Report for This Property
The Home Valuation Report is an in-depth analysis detailing your home's value as well as a comparison with similar homes in the area
Home Values in the Area
Average Home Value in this Area
Purchase History
| Date | Buyer | Sale Price | Title Company |
|---|---|---|---|
| Jaramillo Patrick | $300,000 | Lsi Title Agency Inc | |
| Wells Fargo Bank Na | $369,750 | Fidelity National Title | |
| Torres Adan | -- | Chicago Title Company | |
| Torres Amanda | $575,000 | Chicago Title Co | |
| -- | $179,000 | -- | |
| -- | $122,900 | -- |
Source: Public Records
Mortgage History
| Date | Status | Borrower | Loan Amount |
|---|---|---|---|
| Open | Jaramillo Patrick | $51,000 | |
| Open | Jaramillo Patrick | $240,000 | |
| Previous Owner | Torres Amanda | $488,750 |
Source: Public Records
Tax History
| Year | Tax Paid | Tax Assessment Tax Assessment Total Assessment is a certain percentage of the fair market value that is determined by local assessors to be the total taxable value of land and additions on the property. | Land | Improvement |
|---|---|---|---|---|
| 2025 | $4,564 | $386,307 | $180,277 | $206,030 |
| 2024 | $4,564 | $378,734 | $176,743 | $201,991 |
| 2023 | $4,497 | $371,309 | $173,278 | $198,031 |
| 2022 | $4,366 | $364,030 | $169,881 | $194,149 |
| 2021 | $4,267 | $356,893 | $166,550 | $190,343 |
| 2020 | $4,166 | $353,235 | $164,843 | $188,392 |
| 2019 | $4,058 | $346,310 | $161,611 | $184,699 |
| 2018 | $3,992 | $339,521 | $158,443 | $181,078 |
| 2017 | $13 | $332,865 | $155,337 | $177,528 |
| 2016 | $3,807 | $326,340 | $152,292 | $174,048 |
| 2015 | $3,752 | $321,439 | $150,005 | $171,434 |
| 2014 | $3,677 | $315,143 | $147,067 | $168,076 |
Source: Public Records
Map
Nearby Homes
- 941 Redbud Rd
- 871 Blackwood Rd
- 1065 Sage View
- 945 E J St
- 695 Calma Place
- 826 Cinnamon Ct
- 820 Cardamom Ct
- 1008 Calma Dr
- 937 Paseo la Cresta
- 715 Paso de Luz
- 1038 Dorado Ct
- 664 Rainbow Dr
- 843 Caminito Las Olas
- 1060 Via Sinuoso
- 919 Caminito Estrella
- 1233 Equinox Way
- 737 Duoro Dr
- 940 Sullivan Ct
- 728 Cardona Ave
- 607 E J St
- 824 Cedarbend Way
- 818 Cedarbend Way
- 816 Cedarbend Way
- 826 Cedarbend Way
- 931 Redbud Rd
- 929 Redbud Rd
- 933 Redbud Rd
- 828 Cedarbend Way
- 927 Redbud Rd
- 812 Cedarbend Way
- 935 Redbud Rd
- 925 Redbud Rd
- 821 Cedarbend Way
- 823 Cedarbend Way
- 937 Redbud Rd
- 819 Cedarbend Way
- 830 Cedarbend Way
- 825 Cedarbend Way
- 817 Cedarbend Way
- 810 Cedarbend Way
Your Personal Tour Guide
Ask me questions while you tour the home.