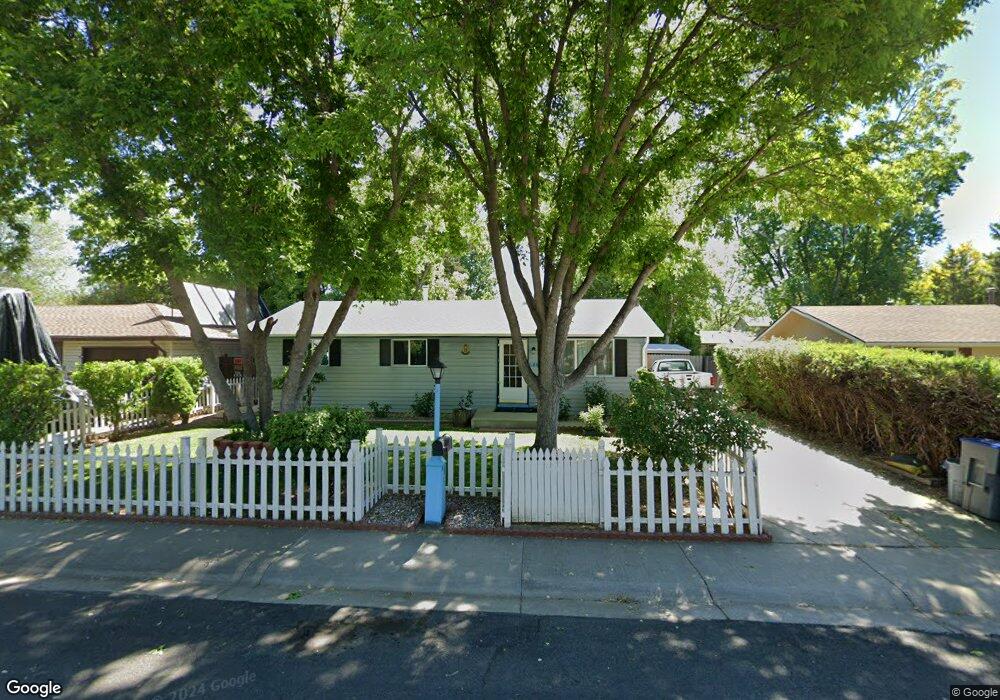
820 Mount Evans St Longmont, CO 80504
Kensington NeighborhoodEstimated Value: $391,600 - $453,000
3
Beds
1
Bath
1,076
Sq Ft
$387/Sq Ft
Est. Value
About This Home
This home is located at 820 Mount Evans St, Longmont, CO 80504 and is currently estimated at $416,400, approximately $386 per square foot. 820 Mount Evans St is a home located in Boulder County with nearby schools including Columbine Elementary School, Trail Ridge Middle School, and Skyline High School.
Ownership History
Date
Name
Owned For
Owner Type
Purchase Details
Closed on
May 24, 1999
Sold by
Mae Stark Kenneth E and Mae Teresa
Bought by
Rios Benigno C
Current Estimated Value
Home Financials for this Owner
Home Financials are based on the most recent Mortgage that was taken out on this home.
Original Mortgage
$112,484
Outstanding Balance
$28,703
Interest Rate
6.89%
Mortgage Type
FHA
Estimated Equity
$387,697
Purchase Details
Closed on
Feb 18, 1994
Sold by
Stark Kenneth E
Bought by
Stark Kenneth E
Home Financials for this Owner
Home Financials are based on the most recent Mortgage that was taken out on this home.
Original Mortgage
$59,843
Interest Rate
6.95%
Mortgage Type
FHA
Purchase Details
Closed on
Dec 2, 1991
Bought by
Rios Benigno C and Viezcas Guadalupe M
Purchase Details
Closed on
Jun 29, 1990
Bought by
Rios Benigno C and Viezcas Guadalupe M
Create a Home Valuation Report for This Property
The Home Valuation Report is an in-depth analysis detailing your home's value as well as a comparison with similar homes in the area
Home Values in the Area
Average Home Value in this Area
Purchase History
| Date | Buyer | Sale Price | Title Company |
|---|---|---|---|
| Rios Benigno C | $113,250 | -- | |
| Stark Kenneth E | -- | Stewart Title | |
| Rios Benigno C | $59,100 | -- | |
| Rios Benigno C | $57,000 | -- |
Source: Public Records
Mortgage History
| Date | Status | Borrower | Loan Amount |
|---|---|---|---|
| Open | Rios Benigno C | $112,484 | |
| Previous Owner | Stark Kenneth E | $59,843 | |
| Closed | Rios Benigno C | $4,200 |
Source: Public Records
Tax History
| Year | Tax Paid | Tax Assessment Tax Assessment Total Assessment is a certain percentage of the fair market value that is determined by local assessors to be the total taxable value of land and additions on the property. | Land | Improvement |
|---|---|---|---|---|
| 2025 | $1,925 | $22,132 | $9,663 | $12,469 |
| 2024 | $1,925 | $22,132 | $9,663 | $12,469 |
| 2023 | $1,898 | $20,120 | $10,599 | $13,206 |
| 2022 | $1,786 | $18,049 | $7,464 | $10,585 |
| 2021 | $1,809 | $18,568 | $7,679 | $10,889 |
| 2020 | $1,673 | $17,218 | $6,507 | $10,711 |
| 2019 | $1,646 | $17,218 | $6,507 | $10,711 |
| 2018 | $1,339 | $14,098 | $5,544 | $8,554 |
| 2017 | $1,321 | $15,585 | $6,129 | $9,456 |
| 2016 | $1,123 | $11,749 | $5,015 | $6,734 |
| 2015 | $1,070 | $10,428 | $3,423 | $7,005 |
| 2014 | $974 | $10,428 | $3,423 | $7,005 |
Source: Public Records
Map
Nearby Homes
- 815 Hilltop St
- 225 E 8th Ave Unit E20
- 225 E 8th Ave Unit F2
- 225 E 8th Ave Unit C14
- 244 Sorento Place
- 820 Brookside Dr
- 145 Placer Ave
- 631 Rider Ridge Rd
- 500 Lashley St Unit 48
- 262 E 5th Ave
- 902 Sugar Mill Ave
- 830 Martin St
- 140 E 5th Ave
- 136 E 5th Ave
- 128 E 5th Ave
- 845 Martin St
- 10 9th Ave Unit 18
- 240 Wadsworth Cir
- 29 Marshall Place
- 524 Rider Ridge Dr
- 826 Mount Evans St
- 814 Mount Evans St
- 821 Hilltop St
- 827 Hilltop St
- 832 Mount Evans St
- 808 Mount Evans St
- 809 Hilltop St
- 819 Mount Evans St
- 833 Hilltop St
- 825 Mount Evans St
- 813 Mount Evans St
- 838 Mount Evans St
- 326 E 8th Ave
- 831 Mount Evans St
- 807 Mount Evans St
- 337 Meeker Place
- 334 E 8th Ave
- 822 Hilltop St
- 816 Hilltop St
- 309 Meeker Place
Your Personal Tour Guide
Ask me questions while you tour the home.