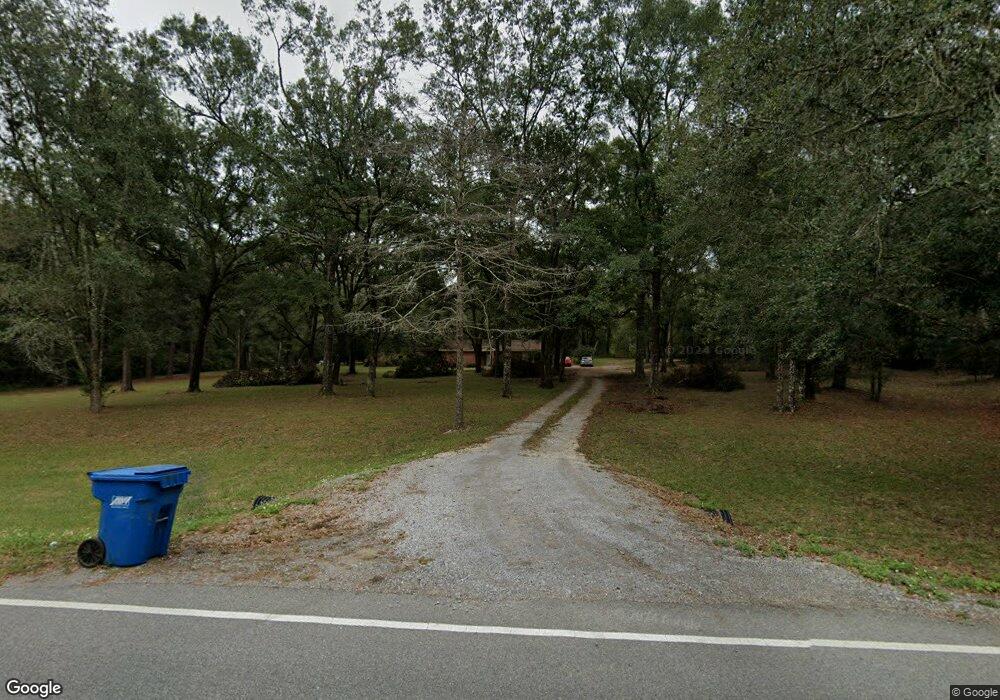
8200 Frank Snell Rd Moss Point, MS 39562
Estimated Value: $185,713 - $320,000
--
Bed
2
Baths
1,008
Sq Ft
$243/Sq Ft
Est. Value
About This Home
This home is located at 8200 Frank Snell Rd, Moss Point, MS 39562 and is currently estimated at $244,571, approximately $242 per square foot. 8200 Frank Snell Rd is a home located in Jackson County with nearby schools including East Central Lower Elementary School, East Central Upper Elementary School, and East Central Middle School.
Ownership History
Date
Name
Owned For
Owner Type
Purchase Details
Closed on
Aug 25, 2023
Sold by
Whitney Derek
Bought by
Whitney Kathy and Whitney Shawn
Current Estimated Value
Home Financials for this Owner
Home Financials are based on the most recent Mortgage that was taken out on this home.
Original Mortgage
$135,440
Outstanding Balance
$132,439
Interest Rate
6.96%
Mortgage Type
New Conventional
Estimated Equity
$112,132
Purchase Details
Closed on
Mar 25, 2022
Sold by
Thompson Alice B
Bought by
Whitney Derek
Home Financials for this Owner
Home Financials are based on the most recent Mortgage that was taken out on this home.
Original Mortgage
$171,830
Interest Rate
4.42%
Mortgage Type
FHA
Create a Home Valuation Report for This Property
The Home Valuation Report is an in-depth analysis detailing your home's value as well as a comparison with similar homes in the area
Home Values in the Area
Average Home Value in this Area
Purchase History
| Date | Buyer | Sale Price | Title Company |
|---|---|---|---|
| Whitney Kathy | -- | Island Winds Title | |
| Whitney Derek | -- | None Listed On Document |
Source: Public Records
Mortgage History
| Date | Status | Borrower | Loan Amount |
|---|---|---|---|
| Open | Whitney Kathy | $135,440 | |
| Previous Owner | Whitney Derek | $171,830 |
Source: Public Records
Tax History Compared to Growth
Tax History
| Year | Tax Paid | Tax Assessment Tax Assessment Total Assessment is a certain percentage of the fair market value that is determined by local assessors to be the total taxable value of land and additions on the property. | Land | Improvement |
|---|---|---|---|---|
| 2024 | $960 | $9,245 | $3,265 | $5,980 |
| 2023 | $960 | $9,245 | $3,265 | $5,980 |
| 2022 | $1,618 | $13,868 | $4,898 | $8,970 |
| 2021 | $1,628 | $13,964 | $4,898 | $9,066 |
| 2020 | $1,560 | $12,913 | $4,535 | $8,378 |
| 2019 | $1,543 | $12,913 | $4,535 | $8,378 |
| 2018 | $1,573 | $12,913 | $4,535 | $8,378 |
| 2017 | $1,600 | $12,913 | $4,535 | $8,378 |
| 2016 | $132 | $8,608 | $3,023 | $5,585 |
| 2015 | $74 | $81,190 | $30,230 | $50,960 |
| 2014 | $73 | $8,119 | $3,023 | $5,096 |
| 2013 | $75 | $8,159 | $3,023 | $5,136 |
Source: Public Records
Map
Nearby Homes
- 7805 Songbird Ln
- 0 Dap Rd E
- 01 Dap Rd E
- 18517 Goff Farm Rd
- 8200 Butler Rd
- 17500 Goff Farm Rd
- 27 Acres Brinkman Rd E
- -0- Rayford Shumock Rd
- 0 R B Dickerson Rd
- 0 Rayford Shumock Rd Unit 24406728
- 0 Rayford Shumock Rd Unit 4121875
- 7605 Methodist Church Rd
- 0 Mississippi 614
- 21551 John Holder Rd
- 8012 Coleman Homestead Rd
- 21217 E Trails End Rd
- 22020 John Holder Rd
- 6105 Mccormack Rd
- 6709 Caraway Rd
- 19255 Eli Dudley Rd
- 19000 Goff Farm Rd
- 18824 Goff Farm Rd
- 18820 Goff Farm Rd
- 8251 Frank Snell Rd
- Nhn Goff Farm Rd
- 19031 Goff Farm Rd
- 18800 Goff Farm Rd
- 19027 Goff Farm Rd
- 18809 Goff Farm Rd
- 8100 Frank Snell Rd
- 19301 Branch Rd
- 19001 Goff Farm Rd
- 8101 Frank Snell Rd
- 18726 Goff Farm Rd
- Parcel 1 Oak Grove Subdivision
- 7813 Songbird Ln
- 18676 Goff Farm Rd
- 19101 Branch Rd
- 7912 Frank Snell Rd
- 8305 Frank Snell Rd