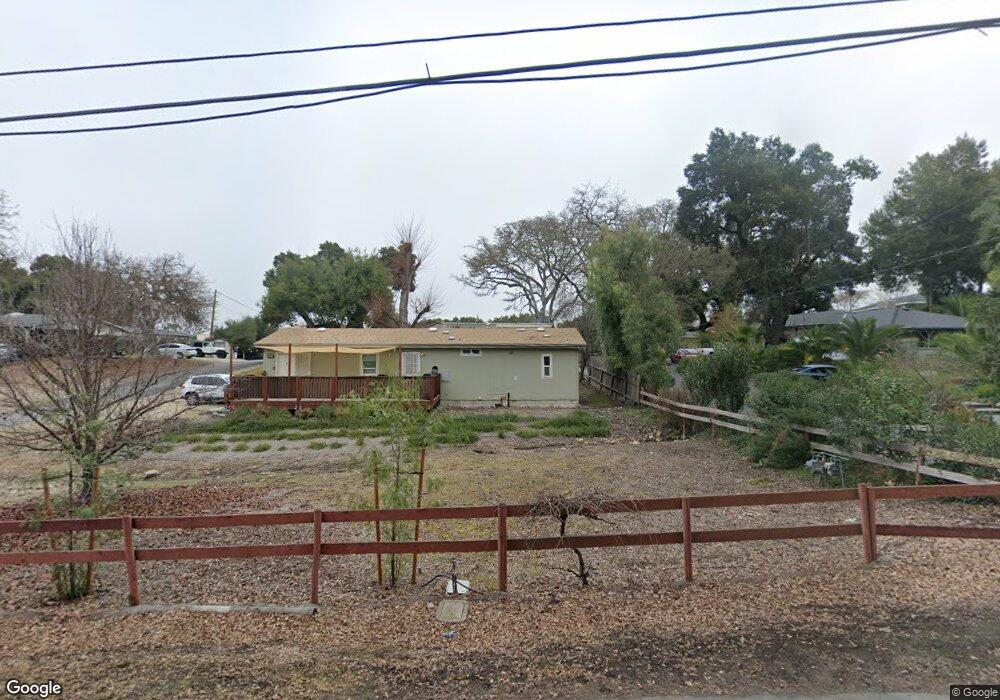
8205 Coromar Ave Atascadero, CA 93422
Estimated Value: $663,000 - $851,000
5
Beds
4
Baths
2,496
Sq Ft
$295/Sq Ft
Est. Value
About This Home
This home is located at 8205 Coromar Ave, Atascadero, CA 93422 and is currently estimated at $735,333, approximately $294 per square foot. 8205 Coromar Ave is a home located in San Luis Obispo County with nearby schools including Santa Rosa Road Academic Academy, Atascadero Middle School, and Atascadero High School.
Ownership History
Date
Name
Owned For
Owner Type
Purchase Details
Closed on
Mar 2, 2022
Sold by
Michael Griffith
Bought by
Patricia R Johnstone Living Trust
Current Estimated Value
Home Financials for this Owner
Home Financials are based on the most recent Mortgage that was taken out on this home.
Original Mortgage
$248,000
Outstanding Balance
$230,243
Interest Rate
3.69%
Mortgage Type
New Conventional
Estimated Equity
$505,090
Purchase Details
Closed on
Jan 9, 2017
Sold by
Johnstone Patricia R
Bought by
Johnstone Patricia R
Create a Home Valuation Report for This Property
The Home Valuation Report is an in-depth analysis detailing your home's value as well as a comparison with similar homes in the area
Home Values in the Area
Average Home Value in this Area
Purchase History
| Date | Buyer | Sale Price | Title Company |
|---|---|---|---|
| Patricia R Johnstone Living Trust | -- | Placer Title | |
| Johnstone Patricia R | -- | None Available |
Source: Public Records
Mortgage History
| Date | Status | Borrower | Loan Amount |
|---|---|---|---|
| Open | Patricia R Johnstone Living Trust | $248,000 |
Source: Public Records
Tax History
| Year | Tax Paid | Tax Assessment Tax Assessment Total Assessment is a certain percentage of the fair market value that is determined by local assessors to be the total taxable value of land and additions on the property. | Land | Improvement |
|---|---|---|---|---|
| 2025 | $5,441 | $401,188 | $190,957 | $210,231 |
| 2024 | $5,440 | $393,322 | $187,213 | $206,109 |
| 2023 | $5,440 | $385,611 | $183,543 | $202,068 |
| 2022 | $5,135 | $378,051 | $179,945 | $198,106 |
| 2021 | $3,909 | $283,217 | $166,613 | $116,604 |
| 2020 | $3,464 | $280,314 | $164,905 | $115,409 |
| 2019 | $3,342 | $274,819 | $161,672 | $113,147 |
| 2018 | $3,239 | $269,431 | $158,502 | $110,929 |
| 2017 | $3,179 | $264,149 | $155,395 | $108,754 |
| 2016 | $3,120 | $258,971 | $152,349 | $106,622 |
| 2015 | $3,075 | $255,082 | $150,061 | $105,021 |
| 2014 | $2,828 | $250,086 | $147,122 | $102,964 |
Source: Public Records
Map
Nearby Homes
- 8740 El Camino Real Unit A
- 0 Cascada Unit NS25147099
- 8920 Arcade Rd
- 8120 Azucena Ave
- 7605 Morro Rd
- 8955 Curbaril Ave
- 7050 Tecorida Ave
- 7478 Santa Ysabel Ave
- 8375 Amapoa Ave
- 8397 Amapoa Ave
- 8399 Amapoa Ave
- 7100 Morro Rd
- 7025 Los Arboles Ave
- 7520 Sombrilla Ave
- 8980 Junipero Ave
- 6265 Tecorida Ave Unit 8
- 8865 Pino Solo Ave
- 8640 Paseo de Caballo
- 6855 Atascadero Ave
- 9045 San Gabriel Rd
- 8255 Coromar Ave
- 8195 Coromar Ave
- 8201 Coromar Ave
- 8245 Coromar Ave
- 8105 Coromar Ave
- 8265 Coromar Ave
- 8210 Coromar Ave
- 8285 Coromar Ave
- 8080 Coromar Ave
- 8275 Coromar Ave
- 8197 Coromar Ave
- 8215 Coromar Ave
- 9065 Pajaro Ln
- 8075 Coromar Ave
- 8250 Coromar Ave
- 8055 Coromar Ave
- 8120 Coromar Ave
- 8305 Coromar Ave
- 9025 Pajaro Ln
- 9045 Pajaro Ln
Your Personal Tour Guide
Ask me questions while you tour the home.