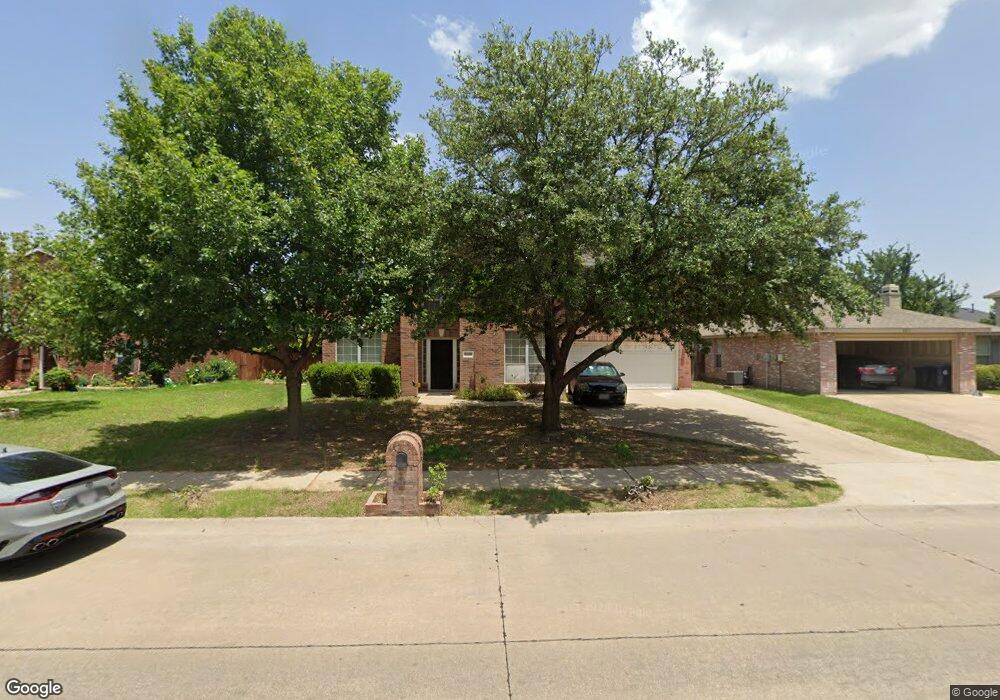
8209 Montecito Dr Denton, TX 76210
South Denton NeighborhoodEstimated Value: $356,000 - $407,000
4
Beds
3
Baths
2,749
Sq Ft
$135/Sq Ft
Est. Value
About This Home
This home is located at 8209 Montecito Dr, Denton, TX 76210 and is currently estimated at $370,436, approximately $134 per square foot. 8209 Montecito Dr is a home located in Denton County with nearby schools including McNair Elementary School, Harpool Middle School, and Guyer High School.
Ownership History
Date
Name
Owned For
Owner Type
Purchase Details
Closed on
Sep 13, 2012
Sold by
The Secretary Of Housing & Urban Develop
Bought by
Gleason Philip J and Hill Kalli J
Current Estimated Value
Home Financials for this Owner
Home Financials are based on the most recent Mortgage that was taken out on this home.
Original Mortgage
$116,098
Outstanding Balance
$81,014
Interest Rate
3.75%
Mortgage Type
FHA
Estimated Equity
$289,422
Purchase Details
Closed on
Jul 21, 2010
Sold by
Gray Mark Harlen and Gray Rebecca
Bought by
Bac Home Loans Servicing Lp and Countrywide Home Loans Servicing Lp
Purchase Details
Closed on
Jul 12, 2010
Sold by
Bac Home Loans Servicing Lp
Bought by
The Secretary Of Housing & Urban Develop
Purchase Details
Closed on
Feb 15, 2001
Sold by
Kb Home Lone Star Lp
Bought by
Gray Mark Harlen
Home Financials for this Owner
Home Financials are based on the most recent Mortgage that was taken out on this home.
Original Mortgage
$154,604
Interest Rate
7.19%
Mortgage Type
FHA
Create a Home Valuation Report for This Property
The Home Valuation Report is an in-depth analysis detailing your home's value as well as a comparison with similar homes in the area
Home Values in the Area
Average Home Value in this Area
Purchase History
| Date | Buyer | Sale Price | Title Company |
|---|---|---|---|
| Gleason Philip J | -- | None Available | |
| Bac Home Loans Servicing Lp | $164,967 | None Available | |
| The Secretary Of Housing & Urban Develop | -- | None Available | |
| Gray Mark Harlen | -- | -- |
Source: Public Records
Mortgage History
| Date | Status | Borrower | Loan Amount |
|---|---|---|---|
| Open | Gleason Philip J | $116,098 | |
| Previous Owner | Gray Mark Harlen | $154,604 |
Source: Public Records
Tax History
| Year | Tax Paid | Tax Assessment Tax Assessment Total Assessment is a certain percentage of the fair market value that is determined by local assessors to be the total taxable value of land and additions on the property. | Land | Improvement |
|---|---|---|---|---|
| 2025 | $5,300 | $344,279 | $77,440 | $266,839 |
| 2024 | $6,495 | $336,502 | $0 | $0 |
| 2023 | $4,644 | $305,911 | $77,440 | $299,061 |
| 2022 | $5,904 | $278,101 | $77,440 | $248,543 |
| 2021 | $5,620 | $255,161 | $42,240 | $212,921 |
| 2020 | $5,253 | $229,835 | $42,240 | $191,022 |
| 2019 | $4,985 | $208,941 | $42,240 | $188,768 |
| 2018 | $4,588 | $189,946 | $42,240 | $172,760 |
| 2017 | $4,268 | $172,678 | $38,720 | $145,990 |
| 2016 | $3,754 | $156,980 | $34,144 | $130,856 |
| 2015 | $2,980 | $142,709 | $34,144 | $123,151 |
| 2014 | $2,980 | $129,735 | $34,144 | $95,591 |
| 2013 | -- | $120,000 | $29,920 | $90,080 |
Source: Public Records
Map
Nearby Homes
- 8133 Montecito Dr
- 5021 Split Rock Dr
- 2421 Windhaven Dr
- 5029 Coral Cove
- 2067 Leatherwood Ln
- 8200 Mirror Rock Ln
- 8704 Serenity Way
- 1612 Marble Cove Ln
- 2901 Saddle Dr
- 8405 Seven Oaks Ln
- 7100 Frost Ln
- 7016 Frost Ln
- 1617 Glendora Ct
- 1217 Golden Sand Dr
- 8212 Canoe Ridge Ln
- 6828 Crenshaw Ln
- 6601 Longleaf Ln
- 2614 Dakota Cir
- 1917 Prescott Downs Dr
- 1917 Belmont Park Dr
- 8213 Montecito Dr
- 8205 Montecito Dr
- 2308 Acorn Bend
- 2304 Acorn Bend
- 2312 Acorn Bend
- 8217 Montecito Dr
- 8201 Montecito Dr
- 2300 Acorn Bend
- 2316 Acorn Bend
- 8208 Montecito Dr
- 8212 Montecito Dr
- 8221 Montecito Dr
- 8200 Montecito Dr
- 8216 Montecito Dr
- 2320 Acorn Bend
- 8137 Montecito Dr
- 8140 Montecito Dr
- 8220 Montecito Dr
- 8225 Montecito Dr
- 2224 Acorn Bend
Your Personal Tour Guide
Ask me questions while you tour the home.