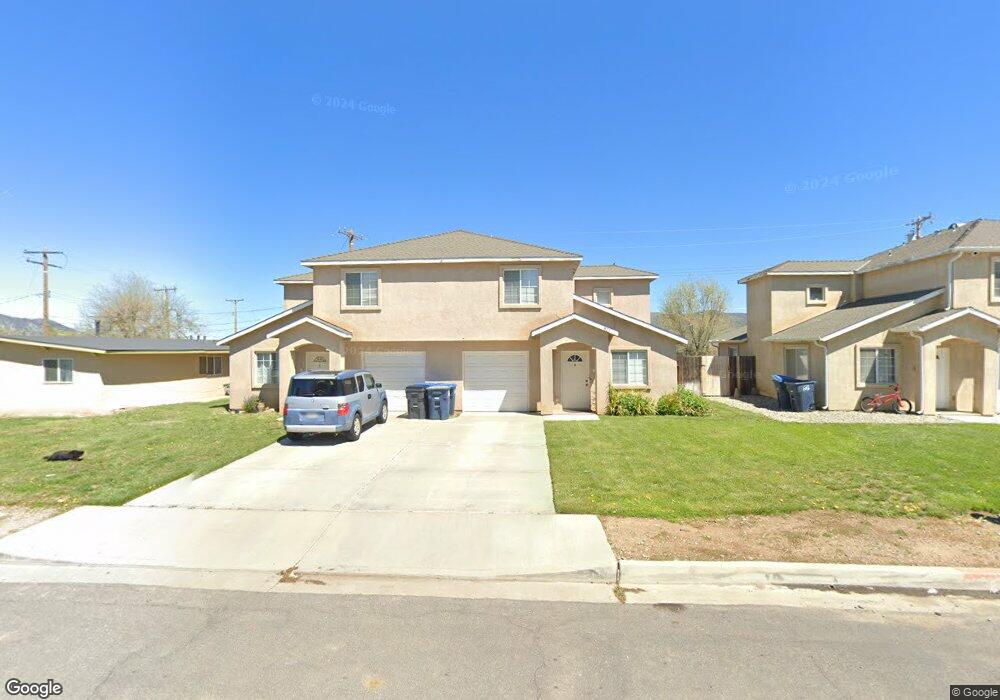
821 Aspen Dr Tehachapi, CA 93561
Estimated Value: $390,999 - $554,000
4
Beds
3
Baths
1,304
Sq Ft
$339/Sq Ft
Est. Value
About This Home
This home is located at 821 Aspen Dr, Tehachapi, CA 93561 and is currently estimated at $441,500, approximately $338 per square foot. 821 Aspen Dr is a home located in Kern County with nearby schools including Tompkins Elementary School, Jacobsen Middle School, and Tehachapi High School.
Ownership History
Date
Name
Owned For
Owner Type
Purchase Details
Closed on
Jun 12, 2025
Sold by
Gwendolyn M Miller Bypass Trust and Blaze Deborah M
Bought by
Sawyer Robbin
Current Estimated Value
Purchase Details
Closed on
Nov 26, 2007
Sold by
Indymac Bank Fsb
Bought by
Miller John R and Gwendolyn M Miller Bypass Trus
Purchase Details
Closed on
Jun 20, 2007
Sold by
Nyiszteruk Mike
Bought by
Indymac Bank Fsb
Purchase Details
Closed on
Apr 3, 2006
Sold by
Michael Mugford Builder Inc
Bought by
Nyiszteruk Mike
Home Financials for this Owner
Home Financials are based on the most recent Mortgage that was taken out on this home.
Original Mortgage
$280,000
Interest Rate
7.37%
Mortgage Type
Purchase Money Mortgage
Purchase Details
Closed on
Jun 20, 2005
Sold by
Boles William Paul and Boles Family Trust
Bought by
Michael Mugford Builder Inc
Home Financials for this Owner
Home Financials are based on the most recent Mortgage that was taken out on this home.
Original Mortgage
$597,525
Interest Rate
5.51%
Mortgage Type
Construction
Create a Home Valuation Report for This Property
The Home Valuation Report is an in-depth analysis detailing your home's value as well as a comparison with similar homes in the area
Home Values in the Area
Average Home Value in this Area
Purchase History
| Date | Buyer | Sale Price | Title Company |
|---|---|---|---|
| Sawyer Robbin | -- | None Listed On Document | |
| Miller John R | $220,000 | Lawyers Title | |
| Indymac Bank Fsb | $297,738 | Accommodation | |
| Nyiszteruk Mike | $350,000 | Fidelity National Title Co | |
| Michael Mugford Builder Inc | $120,000 | Fidelity Title |
Source: Public Records
Mortgage History
| Date | Status | Borrower | Loan Amount |
|---|---|---|---|
| Previous Owner | Nyiszteruk Mike | $280,000 | |
| Previous Owner | Michael Mugford Builder Inc | $597,525 |
Source: Public Records
Tax History
| Year | Tax Paid | Tax Assessment Tax Assessment Total Assessment is a certain percentage of the fair market value that is determined by local assessors to be the total taxable value of land and additions on the property. | Land | Improvement |
|---|---|---|---|---|
| 2025 | $3,651 | $288,955 | $78,802 | $210,153 |
| 2024 | $3,651 | $283,290 | $77,257 | $206,033 |
| 2023 | $3,518 | $277,737 | $75,743 | $201,994 |
| 2022 | $3,475 | $272,292 | $74,258 | $198,034 |
| 2021 | $3,387 | $266,953 | $72,802 | $194,151 |
| 2020 | $3,378 | $264,217 | $72,056 | $192,161 |
| 2019 | $2,893 | $220,000 | $40,000 | $180,000 |
| 2018 | $2,542 | $195,000 | $37,000 | $158,000 |
| 2017 | $2,587 | $195,000 | $30,000 | $165,000 |
| 2016 | $2,567 | $195,000 | $30,000 | $165,000 |
| 2015 | $2,482 | $195,000 | $30,000 | $165,000 |
| 2014 | $1,843 | $140,000 | $25,000 | $115,000 |
Source: Public Records
Map
Nearby Homes
- 817 Beech St
- 817 Oakwood St
- 1149 Redwood Ct
- 1162 Redwood Ct
- 438 Sherwood Place
- 1173 Redwood Ct
- 971 W Valley Blvd
- 406 Oakwood Ct
- 701 Pauley St
- 0 Applewood Dr
- 914 Acacia Ct
- 770 Tucker Rd
- 225 Spruce St
- 0 S Curry St Unit 9987541
- 301 W C St
- 212 Artina Ct
- 210 Pinon St Unit 11
- 210 Pinon St Unit 18
- 210 Pinon St Unit 4
- 210 Pinon St Unit 1
Your Personal Tour Guide
Ask me questions while you tour the home.