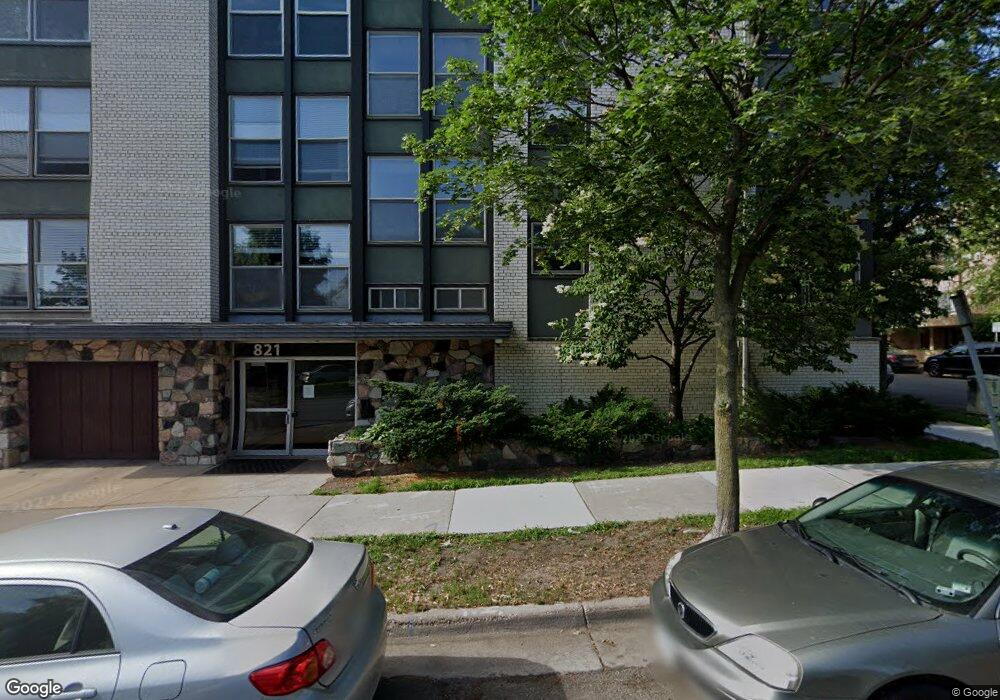
821 Douglas Ave Unit 102 Minneapolis, MN 55403
Lowry Hill NeighborhoodEstimated Value: $225,978 - $347,000
2
Beds
2
Baths
1,047
Sq Ft
$269/Sq Ft
Est. Value
About This Home
This home is located at 821 Douglas Ave Unit 102, Minneapolis, MN 55403 and is currently estimated at $281,495, approximately $268 per square foot. 821 Douglas Ave Unit 102 is a home located in Hennepin County with nearby schools including Kenwood Elementary School, Anwatin Middle School, and North High School.
Ownership History
Date
Name
Owned For
Owner Type
Purchase Details
Closed on
Apr 2, 2010
Sold by
U S Bank National Association Nd
Bought by
Nielsen Katherine
Current Estimated Value
Purchase Details
Closed on
Apr 12, 2006
Sold by
4136 Queen Cag Llc
Bought by
Rivera Gilbon Alfredo
Purchase Details
Closed on
Feb 1, 2005
Sold by
Colonial Properties Of Minnesota Llc
Bought by
4136 Queen Cag Llc
Create a Home Valuation Report for This Property
The Home Valuation Report is an in-depth analysis detailing your home's value as well as a comparison with similar homes in the area
Home Values in the Area
Average Home Value in this Area
Purchase History
| Date | Buyer | Sale Price | Title Company |
|---|---|---|---|
| Nielsen Katherine | $160,000 | -- | |
| Rivera Gilbon Alfredo | $256,100 | -- | |
| 4136 Queen Cag Llc | $1,450,000 | -- |
Source: Public Records
Tax History Compared to Growth
Tax History
| Year | Tax Paid | Tax Assessment Tax Assessment Total Assessment is a certain percentage of the fair market value that is determined by local assessors to be the total taxable value of land and additions on the property. | Land | Improvement |
|---|---|---|---|---|
| 2024 | $2,914 | $218,000 | $22,000 | $196,000 |
| 2023 | $2,800 | $227,000 | $23,000 | $204,000 |
| 2022 | $2,911 | $223,200 | $16,200 | $207,000 |
| 2021 | $2,794 | $216,900 | $16,900 | $200,000 |
| 2020 | $3,208 | $221,500 | $7,800 | $213,700 |
| 2019 | $3,093 | $226,900 | $1,700 | $225,200 |
| 2018 | $2,872 | $214,600 | $2,400 | $212,200 |
| 2017 | $2,732 | $191,000 | $7,800 | $183,200 |
| 2016 | $2,823 | $191,000 | $7,800 | $183,200 |
| 2015 | $2,326 | $159,000 | $7,800 | $151,200 |
| 2014 | -- | $148,500 | $7,800 | $140,700 |
Source: Public Records
Map
Nearby Homes
- 821 Douglas Ave Unit 304
- 821 Douglas Ave Unit 204
- 910 Lincoln Ave Unit B4
- 1785 Dupont Ave S
- 1820 Colfax Ave S
- 510 Groveland Ave Unit 522
- 1912 Dupont Ave S Unit 407
- 425 Oak Grove St
- 1212 Douglas Ave
- 1940 Dupont Ave S
- 1767 Fremont Ave S
- 1932 Dupont Ave S
- 520 Ridgewood Ave Unit 4
- 520 Ridgewood Ave Unit 107
- 400 Groveland Ave Unit 413
- 400 Groveland Ave Unit 708
- 410 Groveland Ave Unit 1906
- 410 Groveland Ave Unit 501
- 410 Groveland Ave Unit 601
- 440 Ridgewood Ave Unit 203
- 821 Douglas Ave
- 821 Douglas Ave Unit 307
- 821 Douglas Ave Unit 306
- 821 Douglas Ave Unit 305
- 821 Douglas Ave Unit 303
- 821 Douglas Ave Unit 302
- 821 Douglas Ave Unit 207
- 821 Douglas Ave Unit 206
- 821 Douglas Ave Unit 205
- 821 Douglas Ave Unit 203
- 821 Douglas Ave Unit 201
- 821 Douglas Ave Unit 107
- 821 Douglas Ave Unit 106
- 821 Douglas Ave Unit 105
- 821 Douglas Ave Unit 104
- 821 Douglas Ave Unit 103
- 821 Douglas Ave Unit 101
- 809 Douglas Ave
- 821 821 Douglas Ave
- 826 Summit Ave