Estimated Value: $651,105 - $704,000
5
Beds
2
Baths
3,436
Sq Ft
$201/Sq Ft
Est. Value
About This Home
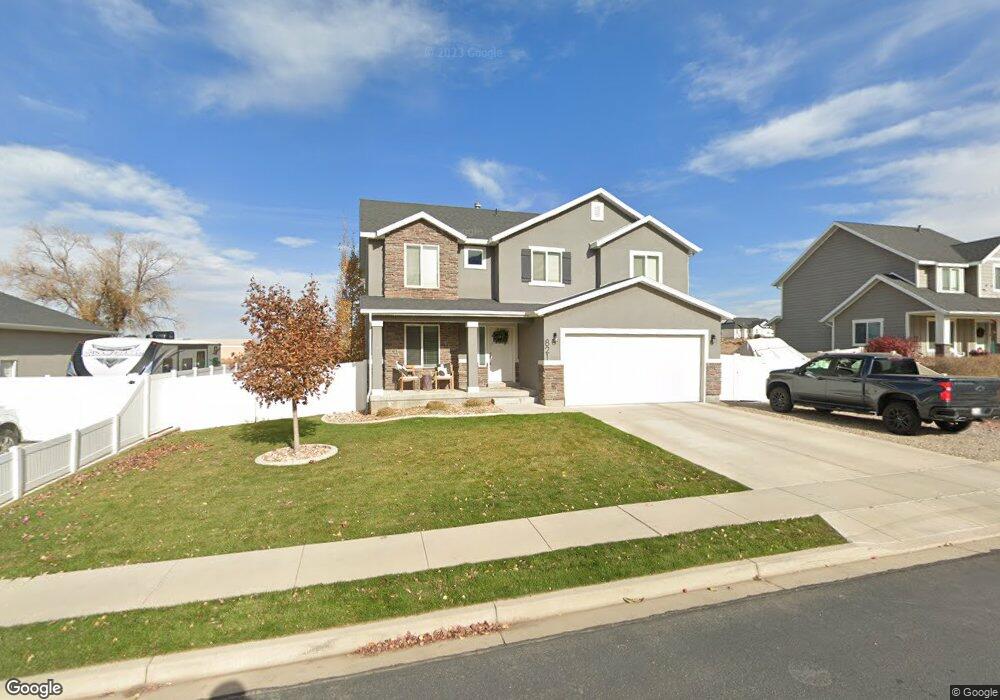
This home is located at 821 E 320 N Unit AUBREY, Salem, UT 84653 and is currently estimated at $689,526, approximately $200 per square foot. 821 E 320 N Unit AUBREY is a home located in Utah County with nearby schools including Salem Elementary, Valley View Middle School, and Salem Junior High School.
Ownership History
Date
Name
Owned For
Owner Type
Purchase Details
Closed on
Oct 23, 2015
Sold by
Salisbury Developers Inc
Bought by
Talbot Bretton H and Talbot Marnie Allene
Current Estimated Value
Home Financials for this Owner
Home Financials are based on the most recent Mortgage that was taken out on this home.
Original Mortgage
$285,182
Outstanding Balance
$223,844
Interest Rate
3.81%
Mortgage Type
New Conventional
Estimated Equity
$465,682
Purchase Details
Closed on
Nov 24, 2014
Sold by
Salisbury Land Llc
Bought by
Salisbury Developers Inc
Home Financials for this Owner
Home Financials are based on the most recent Mortgage that was taken out on this home.
Original Mortgage
$222,700
Interest Rate
4.1%
Mortgage Type
Construction
Purchase Details
Closed on
Nov 3, 2014
Sold by
Garner Jeffrey
Bought by
Salisbury Land Llc
Home Financials for this Owner
Home Financials are based on the most recent Mortgage that was taken out on this home.
Original Mortgage
$222,700
Interest Rate
4.1%
Mortgage Type
Construction
Create a Home Valuation Report for This Property
The Home Valuation Report is an in-depth analysis detailing your home's value as well as a comparison with similar homes in the area
Home Values in the Area
Average Home Value in this Area
Purchase History
| Date | Buyer | Sale Price | Title Company |
|---|---|---|---|
| Talbot Bretton H | -- | Affiliated First Title Co | |
| Salisbury Developers Inc | -- | Provo Land Title Co | |
| Salisbury Land Llc | -- | Provo Land Title Co |
Source: Public Records
Mortgage History
| Date | Status | Borrower | Loan Amount |
|---|---|---|---|
| Open | Talbot Bretton H | $285,182 | |
| Previous Owner | Salisbury Developers Inc | $222,700 |
Source: Public Records
Tax History Compared to Growth
Tax History
| Year | Tax Paid | Tax Assessment Tax Assessment Total Assessment is a certain percentage of the fair market value that is determined by local assessors to be the total taxable value of land and additions on the property. | Land | Improvement |
|---|---|---|---|---|
| 2025 | $3,043 | $335,720 | $222,000 | $388,400 |
| 2024 | $3,043 | $308,660 | $0 | $0 |
| 2023 | $3,092 | $314,160 | $0 | $0 |
| 2022 | $3,414 | $341,550 | $0 | $0 |
| 2021 | $2,523 | $404,900 | $128,700 | $276,200 |
| 2020 | $2,450 | $382,700 | $111,900 | $270,800 |
| 2019 | $2,275 | $362,800 | $108,200 | $254,600 |
| 2018 | $2,107 | $321,200 | $97,400 | $223,800 |
| 2017 | $1,915 | $155,650 | $0 | $0 |
| 2016 | $1,885 | $151,470 | $0 | $0 |
| 2015 | $915 | $72,200 | $0 | $0 |
| 2014 | $712 | $56,300 | $0 | $0 |
Source: Public Records
Map
Nearby Homes
- 384 N 710 E
- 318 N 900 E
- 974 E 400 St N
- 974 E 400 St N Unit 1
- Lennon Plan at Broad Hollow Estates
- Jacqueline Bonus Plan at Broad Hollow Estates
- Thomas Plan at Broad Hollow Estates
- Addison Plan at Broad Hollow Estates
- Graham Plan at Broad Hollow Estates
- Nora Plan at Broad Hollow Estates
- Lyla Plan at Broad Hollow Estates
- Jenni Plan at Broad Hollow Estates
- Washington Plan at Broad Hollow Estates
- Andrea Plan at Broad Hollow Estates
- Hailey Plan at Broad Hollow Estates
- Konlee Plan at Broad Hollow Estates
- Quinn Plan at Broad Hollow Estates
- Alexa Plan at Broad Hollow Estates
- Alydia Plan at Broad Hollow Estates
- Eva Plan at Broad Hollow Estates