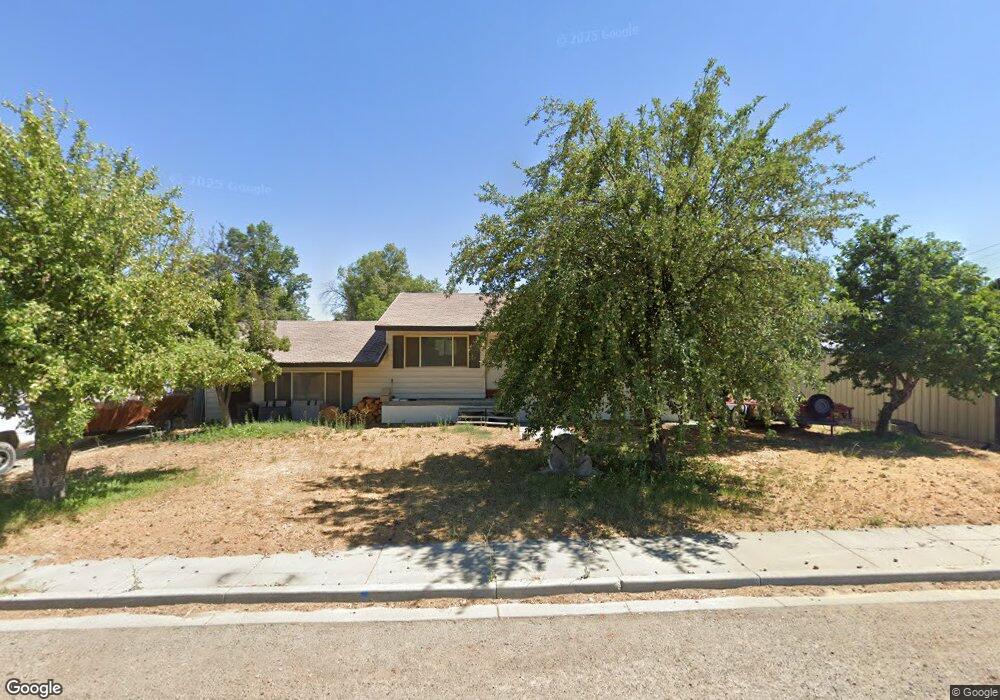
821 Elm St Carlin, NV 89822
Estimated Value: $175,000 - $233,000
4
Beds
2
Baths
1,456
Sq Ft
$141/Sq Ft
Est. Value
About This Home
This home is located at 821 Elm St, Carlin, NV 89822 and is currently estimated at $205,608, approximately $141 per square foot. 821 Elm St is a home with nearby schools including Carlin Elementary School, Carlin Junior High School, and Carlin High School.
Ownership History
Date
Name
Owned For
Owner Type
Purchase Details
Closed on
Dec 31, 2024
Sold by
Young Kenneth E
Bought by
Greene Shirlene M
Current Estimated Value
Create a Home Valuation Report for This Property
The Home Valuation Report is an in-depth analysis detailing your home's value as well as a comparison with similar homes in the area
Home Values in the Area
Average Home Value in this Area
Purchase History
| Date | Buyer | Sale Price | Title Company |
|---|---|---|---|
| Greene Shirlene M | -- | None Listed On Document | |
| Greene Shirlene M | -- | None Listed On Document |
Source: Public Records
Tax History Compared to Growth
Tax History
| Year | Tax Paid | Tax Assessment Tax Assessment Total Assessment is a certain percentage of the fair market value that is determined by local assessors to be the total taxable value of land and additions on the property. | Land | Improvement |
|---|---|---|---|---|
| 2025 | $1,167 | $22,505 | $10,780 | $11,725 |
| 2024 | $1,167 | $34,013 | $7,700 | $26,313 |
| 2023 | $1,081 | $31,864 | $7,700 | $24,164 |
| 2022 | $1,001 | $27,687 | $7,700 | $19,987 |
| 2021 | $981 | $26,770 | $7,700 | $19,070 |
| 2020 | $961 | $26,614 | $7,700 | $18,914 |
| 2019 | $927 | $25,310 | $7,700 | $17,610 |
| 2018 | $917 | $25,038 | $7,700 | $17,338 |
| 2017 | $894 | $24,422 | $7,700 | $16,722 |
| 2016 | $891 | $24,584 | $7,700 | $16,884 |
| 2015 | $903 | $24,982 | $7,700 | $17,282 |
| 2014 | $918 | $24,729 | $7,700 | $17,029 |
Source: Public Records
Map
Nearby Homes
- 711 Elm St
- 0 Elm St
- 521 Elm St
- 710 Cedar St
- 815 Hamilton St
- 1121 Cedar St
- TBD 4th St
- 913 Main St
- 304 Hamilton St
- 0000 Interstate 80
- 213 Cedar St
- 402 W Cedar St
- 0 Bitterrootst Franklin Ave Unit 240013931
- 0 Cathedral St
- 0 Bighorn St
- Daniel Boone St
- 066020017 Bitterroot St
- 066020006 Blue Ridge St
- 066020018 Bitterroot St
- 0 Gravelly St Unit 3626123