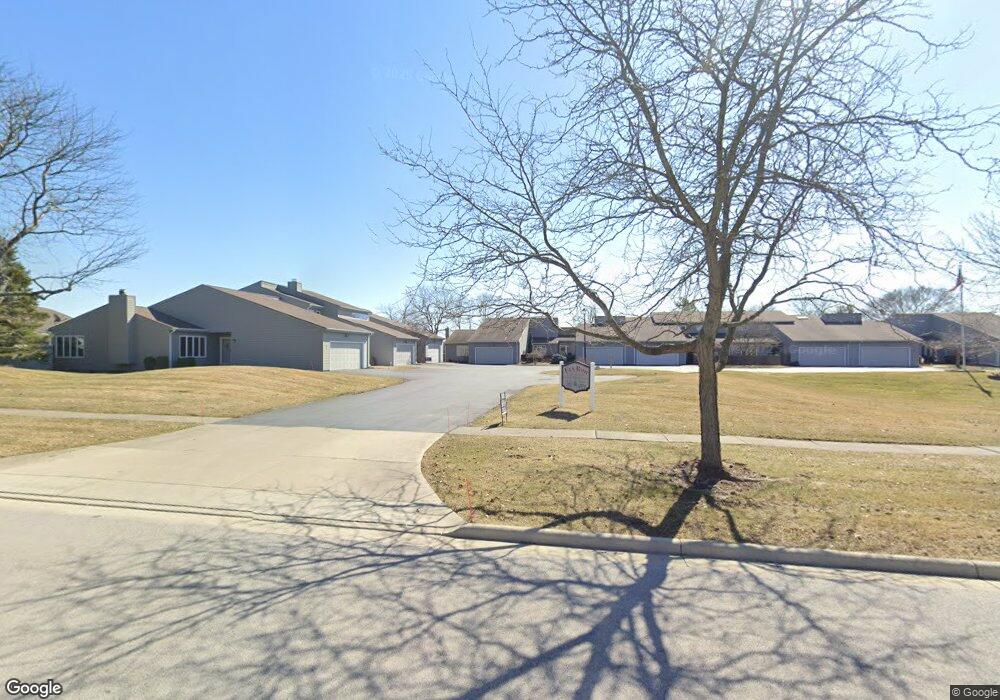
821 Fox Run Rd Unit U9 Findlay, OH 45840
Estimated Value: $219,000 - $269,000
2
Beds
2
Baths
1,660
Sq Ft
$146/Sq Ft
Est. Value
About This Home
This home is located at 821 Fox Run Rd Unit U9, Findlay, OH 45840 and is currently estimated at $241,976, approximately $145 per square foot. 821 Fox Run Rd Unit U9 is a home located in Hancock County with nearby schools including Wilson Vance Elementary School, Whittier Elementary School, and Glenwood Middle School.
Ownership History
Date
Name
Owned For
Owner Type
Purchase Details
Closed on
Oct 8, 2025
Sold by
Wentz Karen
Bought by
Houck Alisa and Wentz Luke
Current Estimated Value
Purchase Details
Closed on
May 13, 2013
Sold by
Bott Shad M and Bott Shaun M
Bought by
Wentz Karen
Purchase Details
Closed on
Jul 20, 2012
Sold by
Hook Daniel J and Hook Paula L
Bought by
Bott Shad M and Bott Shaun M
Purchase Details
Closed on
Nov 8, 2011
Sold by
Hook Daniel J and Hook Paula L
Bought by
Hook Daniel J and Hook Paula L
Purchase Details
Closed on
Jan 3, 2001
Sold by
Bunch Alice J
Bought by
Hook Daniel J and Hook Paula L
Home Financials for this Owner
Home Financials are based on the most recent Mortgage that was taken out on this home.
Original Mortgage
$103,600
Interest Rate
7.77%
Mortgage Type
New Conventional
Purchase Details
Closed on
Jul 18, 1988
Bought by
Bunch Leslie B and Bunch Alice J
Purchase Details
Closed on
Dec 28, 1987
Bought by
Equitable Reloc Mgmt Corp
Purchase Details
Closed on
Dec 3, 1986
Bought by
Spindler Manfred H
Create a Home Valuation Report for This Property
The Home Valuation Report is an in-depth analysis detailing your home's value as well as a comparison with similar homes in the area
Home Values in the Area
Average Home Value in this Area
Purchase History
| Date | Buyer | Sale Price | Title Company |
|---|---|---|---|
| Houck Alisa | -- | Whitman Title | |
| Houck Alisa | -- | Whitman Title | |
| Wentz Karen | $105,000 | Assured Title Agency | |
| Wentz Karen | $105,000 | Assured Title Agency | |
| Bott Shad M | $25,000 | Attorney | |
| Bott Shad M | $25,000 | Attorney | |
| Hook Daniel J | -- | None Available | |
| Hook Daniel J | -- | None Available | |
| Hook Daniel J | $129,500 | -- | |
| Hook Daniel J | $129,500 | -- | |
| Bunch Leslie B | $100,000 | -- | |
| Bunch Leslie B | $100,000 | -- | |
| Equitable Reloc Mgmt Corp | $110,000 | -- | |
| Equitable Reloc Mgmt Corp | $110,000 | -- | |
| Spindler Manfred H | $113,000 | -- | |
| Spindler Manfred H | $113,000 | -- |
Source: Public Records
Mortgage History
| Date | Status | Borrower | Loan Amount |
|---|---|---|---|
| Previous Owner | Hook Daniel J | $103,600 |
Source: Public Records
Tax History
| Year | Tax Paid | Tax Assessment Tax Assessment Total Assessment is a certain percentage of the fair market value that is determined by local assessors to be the total taxable value of land and additions on the property. | Land | Improvement |
|---|---|---|---|---|
| 2024 | $1,876 | $62,600 | $3,680 | $58,920 |
| 2023 | $1,901 | $62,600 | $3,680 | $58,920 |
| 2022 | $1,909 | $62,600 | $3,680 | $58,920 |
| 2021 | $1,863 | $54,530 | $2,800 | $51,730 |
| 2020 | $2,219 | $54,530 | $2,800 | $51,730 |
| 2019 | $2,176 | $54,530 | $2,800 | $51,730 |
| 2018 | $2,043 | $47,020 | $2,800 | $44,220 |
| 2017 | $2,044 | $47,020 | $2,800 | $44,220 |
| 2016 | $2,017 | $47,020 | $2,800 | $44,220 |
| 2015 | $1,996 | $45,640 | $2,800 | $42,840 |
| 2014 | $1,996 | $45,640 | $2,800 | $42,840 |
| 2012 | $2,132 | $48,370 | $2,800 | $45,570 |
Source: Public Records
Map
Nearby Homes
- 821 Fox Run Rd Unit 6
- 845 Fox Run Rd
- 801 Fox Run Rd
- 2245 Fox Run Cir Unit 1037
- 1121 Fox Run Rd
- 827 Abbey Ln
- 701 Red Fox Rd
- 2000 Rush Creek Ct
- 1926 Queenswood Dr
- 456 Strathaven Dr
- 1203 Chateau Ct
- 1825 Greendale Ave
- 1828 Queenswood Dr
- 1724 Queenswood Dr Unit 10 (2-C)
- 2143 Bluestone Dr
- 631 Winterhaven Dr
- 0 Bright Rd Unit 6117142
- 0 Bright Rd Unit 6117138
- 0 Bright Rd Unit 6117143
- 0 Bright Rd Unit 6117148
- 821 Fox Run Rd Unit U8
- 821 Fox Run Rd Unit U7
- 821 Fox Run Rd Unit U6
- 821 Fox Run Rd Unit U5
- 821 Fox Run Rd Unit U4
- 821 Fox Run Rd
- 821 Fox Run U-9
- 831 Fox Run Rd Unit U12
- 831 Fox Run Rd Unit U11
- 831 Fox Run Rd Unit U10
- 801 Fox Run Rd Unit U3
- 801 Fox Run Rd Unit U2
- 801 Fox Run Rd Unit U1
- 801 Fox Run Rd Unit 3
- 801 Fox Run Rd Unit U-2
- 851 Fox Run Rd Unit U4
- 849 Fox Run Rd Unit 3
- 847 Fox Run Rd Unit 2
- 857 Fox Run Rd
- 845 Fox Run Rd Unit U-1
Your Personal Tour Guide
Ask me questions while you tour the home.