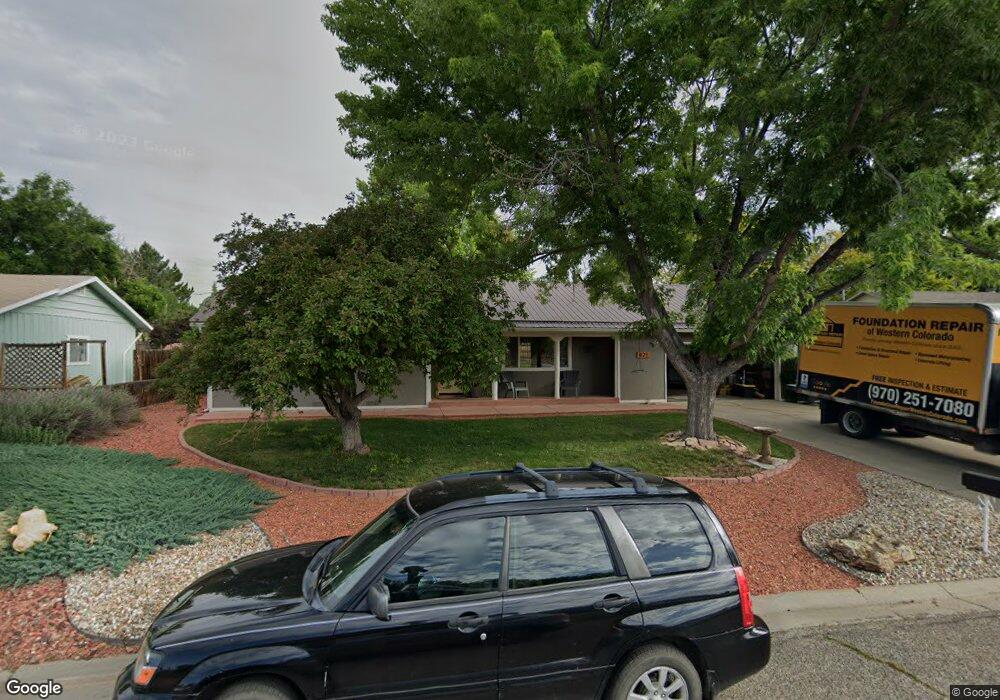
821 Henry St Cortez, CO 81321
Estimated Value: $307,000 - $429,000
3
Beds
2
Baths
1,950
Sq Ft
$182/Sq Ft
Est. Value
About This Home
This home is located at 821 Henry St, Cortez, CO 81321 and is currently estimated at $355,809, approximately $182 per square foot. 821 Henry St is a home located in Montezuma County with nearby schools including Montezuma-Cortez High School, Children's Kiva Montessori School, and Southwest Open Charter School.
Ownership History
Date
Name
Owned For
Owner Type
Purchase Details
Closed on
May 10, 2021
Sold by
Monarco Ashlee Jo and Monarco Tyler A
Bought by
Babcock Kory Daniel and Babcock Esther Christine
Current Estimated Value
Home Financials for this Owner
Home Financials are based on the most recent Mortgage that was taken out on this home.
Original Mortgage
$236,000
Outstanding Balance
$213,875
Interest Rate
3.1%
Mortgage Type
New Conventional
Estimated Equity
$141,934
Purchase Details
Closed on
May 6, 2012
Sold by
Brumley Lynelle
Bought by
Monaco Ashlee Jo and Monarco Tyler A
Home Financials for this Owner
Home Financials are based on the most recent Mortgage that was taken out on this home.
Original Mortgage
$173,469
Interest Rate
3.58%
Mortgage Type
New Conventional
Purchase Details
Closed on
Oct 19, 2004
Sold by
Dotts Audrey L
Bought by
Brumley Lynelle
Create a Home Valuation Report for This Property
The Home Valuation Report is an in-depth analysis detailing your home's value as well as a comparison with similar homes in the area
Home Values in the Area
Average Home Value in this Area
Purchase History
| Date | Buyer | Sale Price | Title Company |
|---|---|---|---|
| Babcock Kory Daniel | $295,000 | Colorado Ttl & Closing Svcs | |
| Monaco Ashlee Jo | $170,000 | Colorado Land Title Co | |
| Brumley Lynelle | $135,000 | -- |
Source: Public Records
Mortgage History
| Date | Status | Borrower | Loan Amount |
|---|---|---|---|
| Open | Babcock Kory Daniel | $236,000 | |
| Previous Owner | Monaco Ashlee Jo | $173,469 |
Source: Public Records
Tax History Compared to Growth
Tax History
| Year | Tax Paid | Tax Assessment Tax Assessment Total Assessment is a certain percentage of the fair market value that is determined by local assessors to be the total taxable value of land and additions on the property. | Land | Improvement |
|---|---|---|---|---|
| 2024 | $766 | $14,907 | $1,987 | $12,920 |
| 2023 | $766 | $19,285 | $2,571 | $16,714 |
| 2022 | $765 | $15,820 | $2,571 | $13,249 |
| 2021 | $778 | $15,820 | $2,571 | $13,249 |
| 2020 | $702 | $14,825 | $2,571 | $12,254 |
| 2019 | $704 | $14,825 | $2,571 | $12,254 |
| 2018 | $703 | $11,030 | $2,330 | $8,700 |
| 2017 | $700 | $11,030 | $2,330 | $8,700 |
| 2016 | $651 | $11,330 | $2,570 | $8,760 |
| 2015 | $597 | $165,030 | $0 | $0 |
| 2014 | $696 | $11,330 | $0 | $0 |
Source: Public Records
Map
Nearby Homes
- 781 Arbor St
- 613 Colorado St
- 721 Arbor St
- 914 Brookside Dr
- 1706 Rampart St
- 1702 E Macarthur Ave
- 510 N Texas St
- TBD Road K 5
- TBD N Sligo St
- 918 Livesay Dr
- 410 N Colorado
- 2310 Laplata St
- 1418 Navajo St
- 1328 Jackson St
- 1459 Acoma St
- 1520 Cochita Dr
- 1560 Cochita Dr
- 1570 Cochita Dr
- 1590 Cochita Dr
- 1580 Cochita Dr