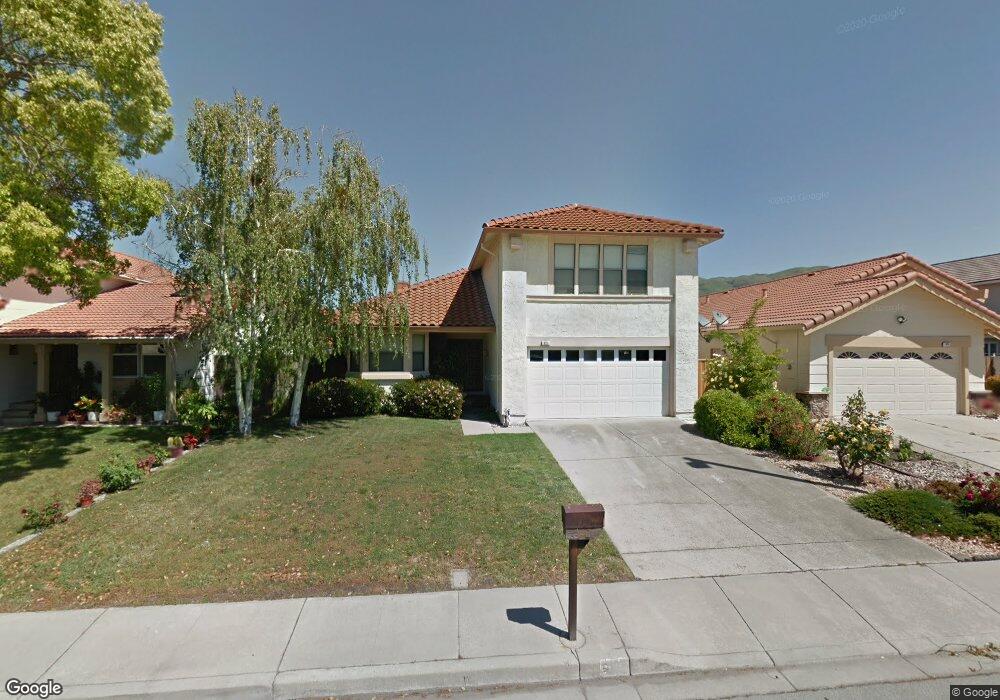
821 Las Lomas Dr Milpitas, CA 95035
Estimated Value: $2,089,000 - $2,233,000
3
Beds
2
Baths
2,217
Sq Ft
$964/Sq Ft
Est. Value
About This Home
This home is located at 821 Las Lomas Dr, Milpitas, CA 95035 and is currently estimated at $2,136,689, approximately $963 per square foot. 821 Las Lomas Dr is a home located in Santa Clara County with nearby schools including Anthony Spangler Elementary School, Thomas Russell Middle School, and Milpitas High School.
Ownership History
Date
Name
Owned For
Owner Type
Purchase Details
Closed on
Jun 26, 2014
Sold by
Wang Mike Ming Yang
Bought by
Wang Mike
Current Estimated Value
Purchase Details
Closed on
Apr 3, 1996
Sold by
Sun Raymond J C
Bought by
Wu Susan
Home Financials for this Owner
Home Financials are based on the most recent Mortgage that was taken out on this home.
Original Mortgage
$118,000
Outstanding Balance
$5,968
Interest Rate
8.12%
Estimated Equity
$2,130,721
Purchase Details
Closed on
Mar 29, 1996
Sold by
Wu Susan
Bought by
Wang Mike Ming Yang
Home Financials for this Owner
Home Financials are based on the most recent Mortgage that was taken out on this home.
Original Mortgage
$118,000
Outstanding Balance
$5,968
Interest Rate
8.12%
Estimated Equity
$2,130,721
Create a Home Valuation Report for This Property
The Home Valuation Report is an in-depth analysis detailing your home's value as well as a comparison with similar homes in the area
Home Values in the Area
Average Home Value in this Area
Purchase History
| Date | Buyer | Sale Price | Title Company |
|---|---|---|---|
| Wang Mike | -- | None Available | |
| Wu Susan | -- | Santa Clara Land Title Co | |
| Wang Mike Ming Yang | $318,000 | Santa Clara Land Title Co |
Source: Public Records
Mortgage History
| Date | Status | Borrower | Loan Amount |
|---|---|---|---|
| Open | Wang Mike Ming Yang | $118,000 |
Source: Public Records
Tax History Compared to Growth
Tax History
| Year | Tax Paid | Tax Assessment Tax Assessment Total Assessment is a certain percentage of the fair market value that is determined by local assessors to be the total taxable value of land and additions on the property. | Land | Improvement |
|---|---|---|---|---|
| 2025 | $6,109 | $528,256 | $249,177 | $279,079 |
| 2024 | $6,109 | $517,899 | $244,292 | $273,607 |
| 2023 | $6,088 | $507,745 | $239,502 | $268,243 |
| 2022 | $6,064 | $497,790 | $234,806 | $262,984 |
| 2021 | $5,975 | $488,030 | $230,202 | $257,828 |
| 2020 | $5,871 | $483,027 | $227,842 | $255,185 |
| 2019 | $5,805 | $473,557 | $223,375 | $250,182 |
| 2018 | $5,515 | $464,273 | $218,996 | $245,277 |
| 2017 | $5,443 | $455,170 | $214,702 | $240,468 |
| 2016 | $5,221 | $446,246 | $210,493 | $235,753 |
| 2015 | $5,167 | $439,544 | $207,332 | $232,212 |
| 2014 | $5,100 | $430,935 | $203,271 | $227,664 |
Source: Public Records
Map
Nearby Homes
- 800 Los Positos Dr
- 253 Park Hill Dr
- 685 Parvin Dr
- 1000 Jacklin Rd
- 521 Topham Ct
- 830 Aaron Park Dr
- 773 Heflin St
- 1084 N Hillview Dr
- 350 Hearst Dr
- 496 Dempsey Rd Unit 199
- 1501 Canton Dr
- 559 Bayview Park Dr
- 7280 Marylinn Dr
- 484 Dempsey Rd Unit 185
- 0 Railroad Ave
- 99 Jacklin Ct
- 7 Crystal Ct
- 17 Terfidia Ln
- 207 Redwood Ave
- 1209 Glacier Dr
- 829 Las Lomas Dr
- 813 Las Lomas Dr
- 822 Alcosta Dr
- 805 Las Lomas Dr
- 837 Las Lomas Dr
- 814 Alcosta Dr
- 830 Alcosta Dr
- 806 Alcosta Dr
- 820 Las Lomas Dr
- 812 Las Lomas Dr
- 838 Alcosta Dr
- 845 Las Lomas Dr
- 797 Las Lomas Dr
- 828 Las Lomas Dr
- 804 Las Lomas Dr
- 836 Las Lomas Dr
- 798 Alcosta Dr
- 846 Alcosta Dr
- 796 Las Lomas Dr
- 853 Las Lomas Dr