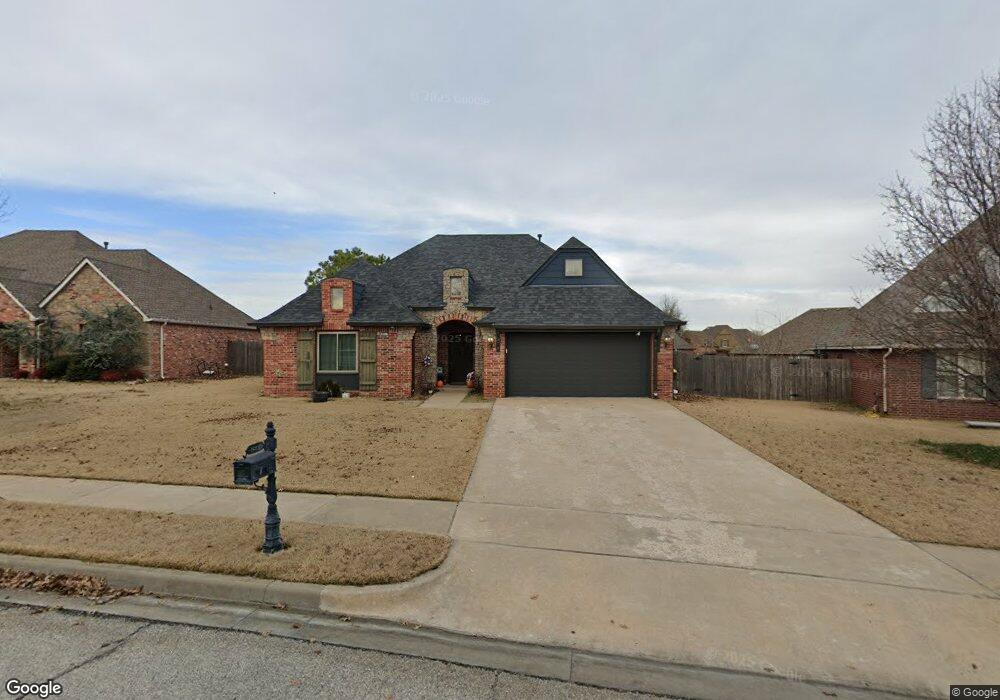
821 W 150th St S Glenpool, OK 74033
Estimated Value: $291,422 - $304,000
3
Beds
2
Baths
1,821
Sq Ft
$163/Sq Ft
Est. Value
About This Home
This home is located at 821 W 150th St S, Glenpool, OK 74033 and is currently estimated at $296,356, approximately $162 per square foot. 821 W 150th St S is a home located in Tulsa County with nearby schools including Glenpool Elementary School, Glenpool Middle School, and Glenpool High School.
Ownership History
Date
Name
Owned For
Owner Type
Purchase Details
Closed on
May 23, 2017
Sold by
Hollcroft Ashley and Hollcroft Derek
Bought by
Iverson Ashley M
Current Estimated Value
Purchase Details
Closed on
Jul 20, 2009
Sold by
Sharp Darlene
Bought by
Sharp Darlene and Wofford Ashley
Purchase Details
Closed on
Aug 16, 2005
Sold by
Cozort Construction Inc
Bought by
Sharp Darlene
Home Financials for this Owner
Home Financials are based on the most recent Mortgage that was taken out on this home.
Original Mortgage
$65,000
Interest Rate
5.81%
Mortgage Type
Fannie Mae Freddie Mac
Create a Home Valuation Report for This Property
The Home Valuation Report is an in-depth analysis detailing your home's value as well as a comparison with similar homes in the area
Home Values in the Area
Average Home Value in this Area
Purchase History
| Date | Buyer | Sale Price | Title Company |
|---|---|---|---|
| Iverson Ashley M | $176,000 | American Abstract & Title Co | |
| Sharp Darlene | -- | None Available | |
| Sharp Darlene | $145,000 | First American Title & Abstr |
Source: Public Records
Mortgage History
| Date | Status | Borrower | Loan Amount |
|---|---|---|---|
| Previous Owner | Sharp Darlene | $65,000 |
Source: Public Records
Tax History Compared to Growth
Tax History
| Year | Tax Paid | Tax Assessment Tax Assessment Total Assessment is a certain percentage of the fair market value that is determined by local assessors to be the total taxable value of land and additions on the property. | Land | Improvement |
|---|---|---|---|---|
| 2024 | $2,287 | $20,155 | $2,340 | $17,815 |
| 2023 | $2,287 | $20,539 | $2,541 | $17,998 |
| 2022 | $2,183 | $18,941 | $3,154 | $15,787 |
| 2021 | $2,148 | $18,360 | $3,057 | $15,303 |
| 2020 | $2,165 | $18,360 | $3,057 | $15,303 |
| 2019 | $2,298 | $19,360 | $3,223 | $16,137 |
| 2018 | $2,288 | $19,360 | $3,223 | $16,137 |
| 2017 | $1,845 | $15,950 | $3,223 | $12,727 |
| 2016 | $1,863 | $15,950 | $3,223 | $12,727 |
| 2015 | $1,854 | $15,950 | $3,223 | $12,727 |
| 2014 | $1,862 | $15,950 | $3,223 | $12,727 |
Source: Public Records
Map
Nearby Homes
- 803 W 150th St
- 15002 S Justin Ave
- 571 W 149th Place
- 598 W 147th Place S
- 14666 S Yukon Ave
- 15375 S 26th West Ave
- 467 W 147th Place S
- 41 E 148th St
- 205 Taos Dr
- 205 Vail Cir
- 13708 S Elwood Ave
- 110 E 156th Place S
- 14336 S Barber St
- 5 E 157th Place S
- 14812 S Fern Place
- 14760 S Fern Place
- 15715 S Broadway St
- 14785 S Fern Place
- 129 Dp Newman Cir
- 14324 S Dogwood St
- 821 W 150th St
- 811 W 150th St
- 811 W 150th St S
- 831 W 150th St
- 826 W 149th Place
- 14930 Courtney Ln
- 836 W 149th Place
- 841 W 150th St
- 816 W 149th Place S
- 816 W 149th Place
- 14936 Courtney Ln
- 820 W 150th St
- 830 W 150th St
- 830 W 150th St S
- 846 W 149th Place
- 801 W 150th St
- 801 W 150th St S
- 851 W 150th St
- 840 W 150th St
- 840 W 150th St S