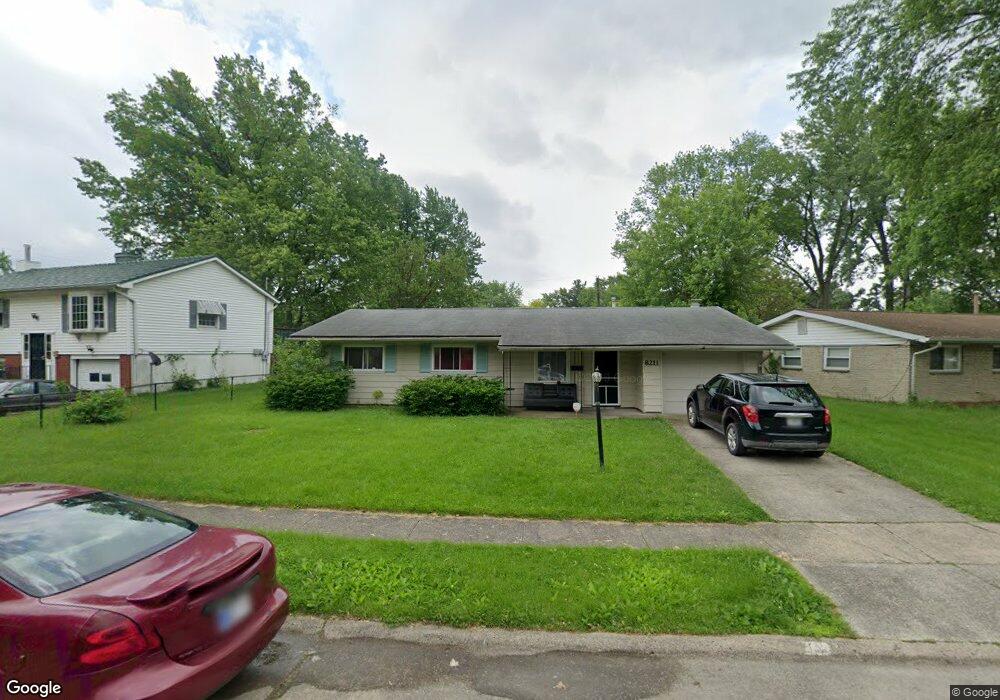
8211 E 37th St Indianapolis, IN 46226
Far Eastside NeighborhoodEstimated Value: $93,000 - $156,144
3
Beds
2
Baths
1,229
Sq Ft
$110/Sq Ft
Est. Value
About This Home
This home is located at 8211 E 37th St, Indianapolis, IN 46226 and is currently estimated at $135,036, approximately $109 per square foot. 8211 E 37th St is a home located in Marion County with nearby schools including Robert Lee Frost School 106, James Whitcomb Riley School 43, and Charles Warren Fairbanks School 105.
Ownership History
Date
Name
Owned For
Owner Type
Purchase Details
Closed on
Sep 8, 2020
Sold by
Equity Trust Co and Michael Drew Ira
Bought by
Menarski Artur Adam and Menarski Karin
Current Estimated Value
Purchase Details
Closed on
Jun 29, 2020
Sold by
Tang Yao Mao
Bought by
Equity Trust Co
Purchase Details
Closed on
Mar 26, 2018
Sold by
Gonzalez Hope
Bought by
Tang Yao-Mao
Purchase Details
Closed on
Oct 27, 2017
Sold by
Jeanne M
Purchase Details
Closed on
Dec 14, 2006
Sold by
Chung Shiu Man and Jung Dicky R
Bought by
Smucker Paul Mark
Home Financials for this Owner
Home Financials are based on the most recent Mortgage that was taken out on this home.
Original Mortgage
$54,400
Interest Rate
6.36%
Mortgage Type
New Conventional
Create a Home Valuation Report for This Property
The Home Valuation Report is an in-depth analysis detailing your home's value as well as a comparison with similar homes in the area
Home Values in the Area
Average Home Value in this Area
Purchase History
| Date | Buyer | Sale Price | Title Company |
|---|---|---|---|
| Menarski Artur Adam | -- | None Listed On Document | |
| Equity Trust Co | $72,000 | Eagle Land Title | |
| Tang Yao-Mao | $77,000 | -- | |
| Tang Yao Mao | $77,000 | Eagle Land Title | |
| Tang Ya Mao | $77,000 | Eagle Land Title | |
| -- | $30,000 | -- | |
| Equity Tryst Co | $30,000 | Paramount Title Agency | |
| Smucker Paul Mark | -- | None Available |
Source: Public Records
Mortgage History
| Date | Status | Borrower | Loan Amount |
|---|---|---|---|
| Previous Owner | Smucker Paul Mark | $54,400 |
Source: Public Records
Tax History
| Year | Tax Paid | Tax Assessment Tax Assessment Total Assessment is a certain percentage of the fair market value that is determined by local assessors to be the total taxable value of land and additions on the property. | Land | Improvement |
|---|---|---|---|---|
| 2025 | $1,917 | $101,500 | $10,700 | $90,800 |
| 2024 | $2,004 | $80,800 | $10,700 | $70,100 |
| 2023 | $2,004 | $80,800 | $10,700 | $70,100 |
| 2022 | $1,795 | $72,400 | $10,700 | $61,700 |
| 2021 | $1,549 | $63,500 | $10,700 | $52,800 |
| 2020 | $1,507 | $61,500 | $12,800 | $48,700 |
| 2019 | $1,521 | $61,000 | $12,800 | $48,200 |
| 2018 | $1,437 | $57,000 | $12,800 | $44,200 |
| 2017 | $1,317 | $58,400 | $12,800 | $45,600 |
| 2016 | $1,289 | $58,400 | $12,800 | $45,600 |
| 2014 | $1,295 | $59,900 | $12,800 | $47,100 |
| 2013 | $1,233 | $59,300 | $12,800 | $46,500 |
Source: Public Records
Map
Nearby Homes
- 3537 Cecil Ave
- 3532 Harvest Ave
- 3851 Esquire Place
- 3640 Marseille Rd
- 3848 Richelieu Rd
- 3432 N Eaton Ave
- 3731 Wellington Ave
- 3909 Richelieu Ct
- 3957 Richelieu Rd
- 8337 Aspen Ct
- 8445 Montery Rd
- 4040 Aspen Way
- 7638 E 37th Place
- 3976 Marseille Rd
- 8246 E 41st Place
- 7628 E 34th Place
- 3938 Biscayne Rd
- 8704 Montery Rd
- 8242 E 42nd St
- 8724 Montery Rd
- 8217 E 37th St
- 8205 E 37th St
- 8216 Penway St
- 8145 E 37th St
- 8210 Penway St
- 8225 E 37th St
- 3666 Harvest Ave
- 8208 E 37th St
- 8218 E 37th St
- 8202 E 37th St
- 8146 E 37th St
- 8226 Penway St
- 8139 E 37th St
- 8204 Penway St
- 8224 E 37th St
- 8140 E 37th St
- 8132 E 37th St
- 8144 Penway St
- 3712 Harvest Ave
- 8133 E 37th St
Your Personal Tour Guide
Ask me questions while you tour the home.