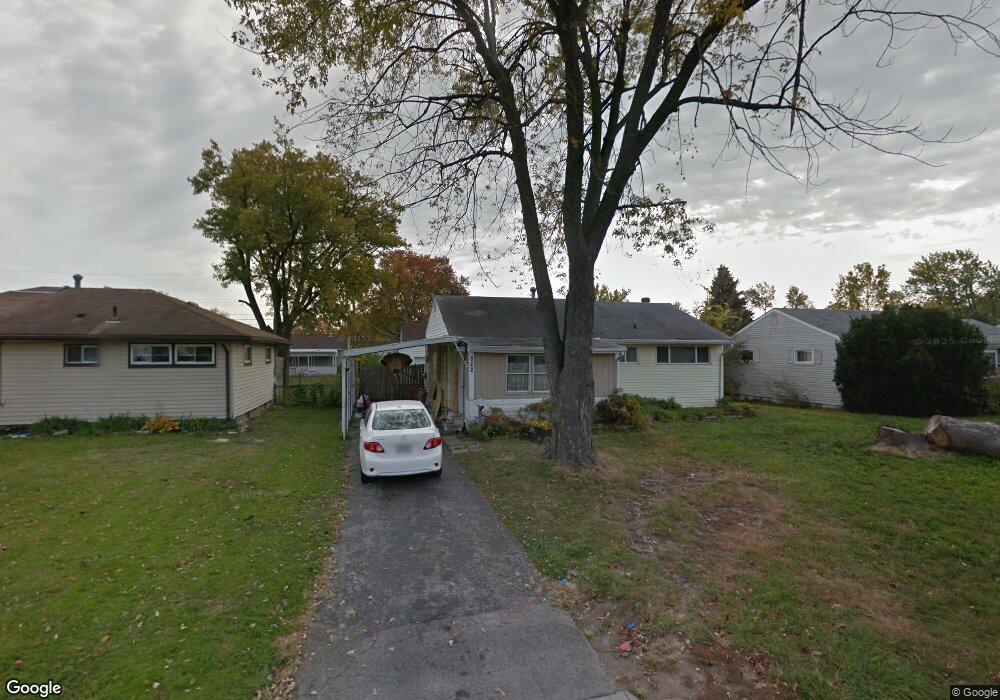
822 Josephine Ave Columbus, OH 43204
Holly Hill NeighborhoodEstimated Value: $205,697 - $225,000
3
Beds
1
Bath
925
Sq Ft
$233/Sq Ft
Est. Value
About This Home
This home is located at 822 Josephine Ave, Columbus, OH 43204 and is currently estimated at $215,174, approximately $232 per square foot. 822 Josephine Ave is a home located in Franklin County with nearby schools including West Franklin Elementary School, Franklin Woods Intermediate School, and Finland Middle School.
Ownership History
Date
Name
Owned For
Owner Type
Purchase Details
Closed on
Apr 19, 2019
Sold by
C10 Investments Llc
Bought by
Henderson Dustin
Current Estimated Value
Home Financials for this Owner
Home Financials are based on the most recent Mortgage that was taken out on this home.
Original Mortgage
$122,735
Outstanding Balance
$109,621
Interest Rate
5.12%
Mortgage Type
FHA
Estimated Equity
$105,553
Purchase Details
Closed on
Nov 6, 2018
Sold by
Hamann Roberta Diane and Hamann David J
Bought by
C10 Investments Llc
Purchase Details
Closed on
Apr 17, 1995
Sold by
Colflesh Fleeta P
Bought by
Guerra Philip A and Guerra Cathy L
Home Financials for this Owner
Home Financials are based on the most recent Mortgage that was taken out on this home.
Original Mortgage
$63,138
Interest Rate
9.5%
Mortgage Type
VA
Create a Home Valuation Report for This Property
The Home Valuation Report is an in-depth analysis detailing your home's value as well as a comparison with similar homes in the area
Home Values in the Area
Average Home Value in this Area
Purchase History
| Date | Buyer | Sale Price | Title Company |
|---|---|---|---|
| Henderson Dustin | $125,000 | Genesis Title Box | |
| C10 Investments Llc | $46,000 | None Available | |
| Guerra Philip A | $61,900 | -- |
Source: Public Records
Mortgage History
| Date | Status | Borrower | Loan Amount |
|---|---|---|---|
| Open | Henderson Dustin | $122,735 | |
| Previous Owner | Guerra Philip A | $63,138 |
Source: Public Records
Tax History Compared to Growth
Tax History
| Year | Tax Paid | Tax Assessment Tax Assessment Total Assessment is a certain percentage of the fair market value that is determined by local assessors to be the total taxable value of land and additions on the property. | Land | Improvement |
|---|---|---|---|---|
| 2024 | $3,340 | $65,490 | $16,420 | $49,070 |
| 2023 | $3,322 | $65,485 | $16,415 | $49,070 |
| 2022 | $3,014 | $40,850 | $8,090 | $32,760 |
| 2021 | $2,864 | $40,850 | $8,090 | $32,760 |
| 2020 | $2,858 | $40,850 | $8,090 | $32,760 |
| 2019 | $2,289 | $28,640 | $6,760 | $21,880 |
| 2018 | $931 | $28,640 | $6,760 | $21,880 |
| 2017 | $2,397 | $28,640 | $6,760 | $21,880 |
| 2016 | $2,005 | $24,330 | $5,080 | $19,250 |
| 2015 | $1,862 | $24,330 | $5,080 | $19,250 |
| 2014 | $1,863 | $24,330 | $5,080 | $19,250 |
| 2013 | $1,076 | $28,595 | $5,950 | $22,645 |
Source: Public Records
Map
Nearby Homes
- 756 Brixham Rd
- 3551 Glorious Rd
- 3727-3729 Briggs Rd
- 781 Stephen Dr W
- 695 Demorest Rd
- 840 Mark Place
- 3318 Miriam Dr S
- 3360 Briggs Rd
- 617 Athens St
- 3874 Eakin Rd
- 585 Athens Ave
- 1027 S Brinker Ave
- 737 S Brinker Ave
- 1243 Trevor Ct
- 3814 Clime Rd
- 3300-3302 Sullivant Ave
- 3997 Briggs Rd
- 3276-3278 Sullivant Ave
- 1226 Pinnacle Dr
- 1181 Onslow Dr
- 814 Josephine Ave
- 830 Josephine Ave
- 806 Josephine Ave
- 838 Josephine Ave
- 825 Joyful St
- 817 Joyful St
- 833 Joyful St
- 809 Joyful St
- 841 Joyful St
- 821 Josephine Ave
- 846 Josephine Ave
- 798 Josephine Ave
- 813 Josephine Ave
- 829 Josephine Ave
- 837 Josephine Ave
- 805 Josephine Ave
- 849 Joyful St
- 854 Josephine Ave
- 790 Josephine Ave
- 845 Josephine Ave