8220 E D St Tacoma, WA 98404
South End NeighborhoodEstimated Value: $365,000 - $378,000
2
Beds
1
Bath
875
Sq Ft
$424/Sq Ft
Est. Value
About This Home
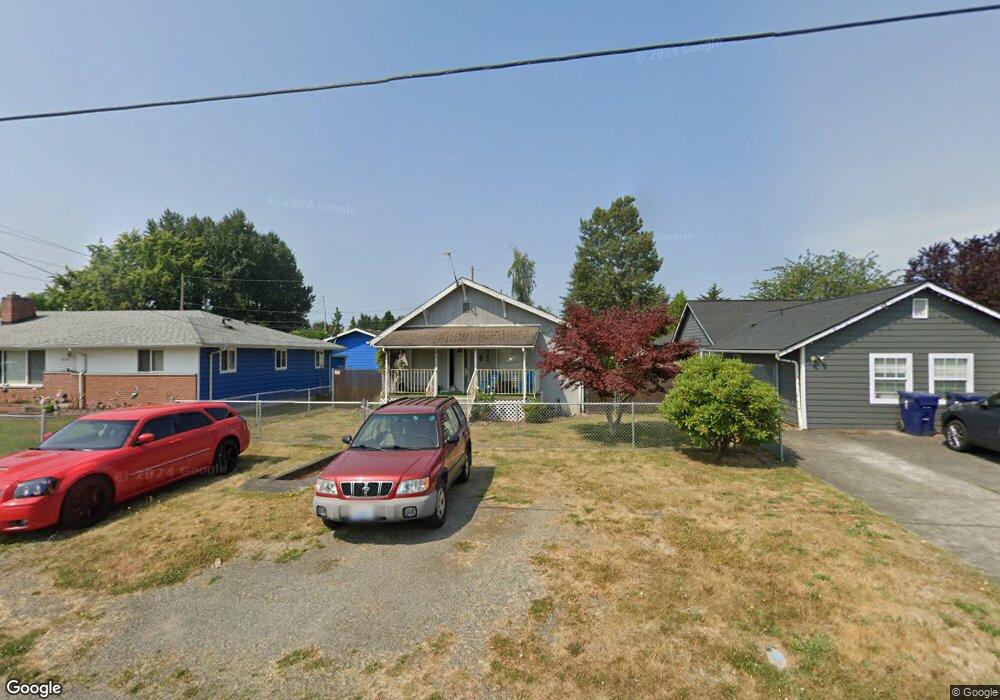
This home is located at 8220 E D St, Tacoma, WA 98404 and is currently estimated at $371,371, approximately $424 per square foot. 8220 E D St is a home located in Pierce County with nearby schools including Larchmont Elementary School, Baker Middle School, and Mount Tahoma High School.
Ownership History
Date
Name
Owned For
Owner Type
Purchase Details
Closed on
Oct 29, 2004
Sold by
Smith Violeta E
Bought by
Floyd Scott and Floyd Velna
Current Estimated Value
Home Financials for this Owner
Home Financials are based on the most recent Mortgage that was taken out on this home.
Original Mortgage
$122,084
Outstanding Balance
$60,558
Interest Rate
5.69%
Mortgage Type
FHA
Estimated Equity
$310,813
Create a Home Valuation Report for This Property
The Home Valuation Report is an in-depth analysis detailing your home's value as well as a comparison with similar homes in the area
Home Values in the Area
Average Home Value in this Area
Purchase History
| Date | Buyer | Sale Price | Title Company |
|---|---|---|---|
| Floyd Scott | $124,000 | Lawyers Title |
Source: Public Records
Mortgage History
| Date | Status | Borrower | Loan Amount |
|---|---|---|---|
| Open | Floyd Scott | $122,084 | |
| Closed | Floyd Scott | $3,000 |
Source: Public Records
Tax History
| Year | Tax Paid | Tax Assessment Tax Assessment Total Assessment is a certain percentage of the fair market value that is determined by local assessors to be the total taxable value of land and additions on the property. | Land | Improvement |
|---|---|---|---|---|
| 2025 | $3,283 | $324,400 | $193,400 | $131,000 |
| 2024 | $3,283 | $315,000 | $186,300 | $128,700 |
| 2023 | $3,283 | $294,500 | $177,400 | $117,100 |
| 2022 | $2,962 | $306,600 | $166,600 | $140,000 |
| 2021 | $2,700 | $214,400 | $106,100 | $108,300 |
| 2019 | $2,185 | $190,200 | $87,700 | $102,500 |
| 2018 | $2,246 | $167,800 | $71,000 | $96,800 |
| 2017 | $1,988 | $141,900 | $57,100 | $84,800 |
| 2016 | $1,740 | $107,200 | $42,700 | $64,500 |
| 2014 | $1,509 | $99,900 | $40,300 | $59,600 |
| 2013 | $1,509 | $87,500 | $35,500 | $52,000 |
Source: Public Records
Map
Nearby Homes
- 416 E 78th St
- 8212 8th Avenue Ct E Unit 1
- 521 E 78th St
- 7918 Mckinley Ave
- 7552 E F St
- 301 S 82nd St
- 915 90th St E
- 319 S 82nd St
- 7656 Pacific Ave
- 7459 A St
- 610 E 75th St
- 7603 Pacific Ave
- 503 E 91st St
- 8515 Golden Given Rd E
- 7601 S C St
- 7802 Golden Given Rd E
- 8519 Golden Given Rd E
- 8430 Fawcett Ave
- 139 E 92nd St
- 8821 S D St
Your Personal Tour Guide
Ask me questions while you tour the home.